-
- The Champagne 50 index has seen a long-term upward momentum.
- However, since its peak in late 2022 it has turned bearish, pulling back 22.9%.
- February saw its first increase in 16 months in an otherwise gloomy market.
- Would a technical analyst recommend now is the right time to buy champagne?

Champagne prices on the secondary market have seen much movement in recent years. At the end of February, the Champagne 50, which tracks the price performance of the most recent vintages of the 13 most actively traded Champagnes, was 50.2% higher than five years ago. But this does not tell the story of the last 16 months.
The index reached its peak in October 2022 having risen by 42.7% in the previous 12 months. It then declined steadily every month until January 2024, losing 23% over 15 months. Of all the Liv-ex Fine Wine 1000’s sub-indices, only the Rhone 100 fell further in this period.
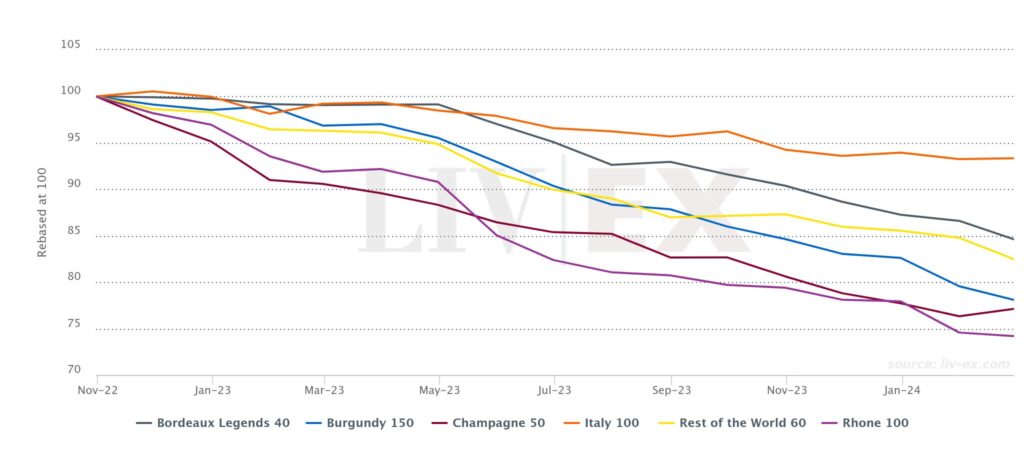
As previously reported, in February the index saw its first monthly gain in 16 months driven by a 19.9% rise in Salon, Le Mesnil Grand Cru, 2012 and an 11.4% rise in Dom Perignon, Rose, 2009. Among the wines in the Champagne 50 in February, Jacques Selosse, Millesime 2008 was the top traded by value whileDom Perignon 2013 was the top traded by volume.
In a stubbornly bearish market, February’s 1% rise offers encouraging signs. With March releases of Krug 2011, Bollinger RD and La Grande Annee 2015, we asked a technical analyst whether now is the right time to buy Champagne?
The Champagne 50 has been in a long-term bull phase as the chart below shows. However, since November 2022 it has been firmly bearish until February’s uptick. The Fibonacci Retracement demonstrates that it has pulled back by 50% since the upward trend accelerated in March 2020.
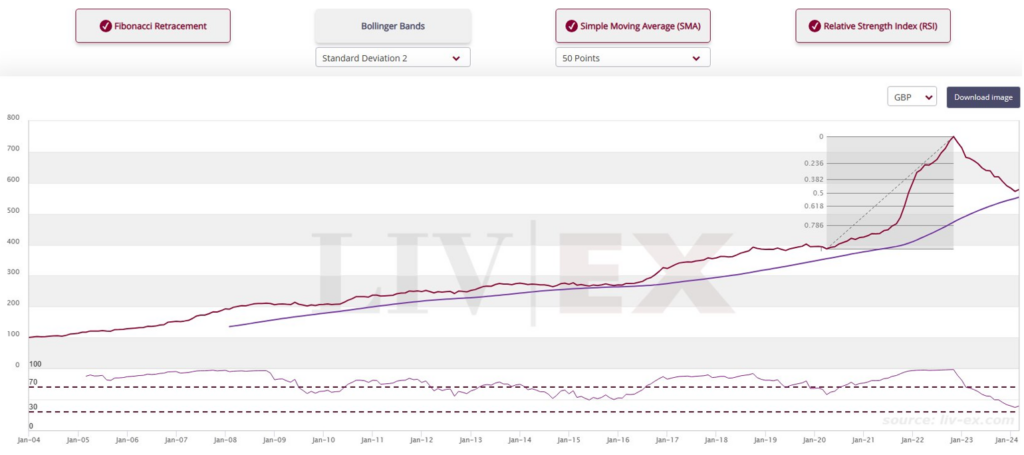
The index’s bearish momentum is evidenced by the Relative Strength Index (RSI), which remains below the ’50 line’, a level it has reached only seven times since its inception. This momentum is far from extreme levels; it’s yet to test the ’30 line’. This should be monitored over the coming months.
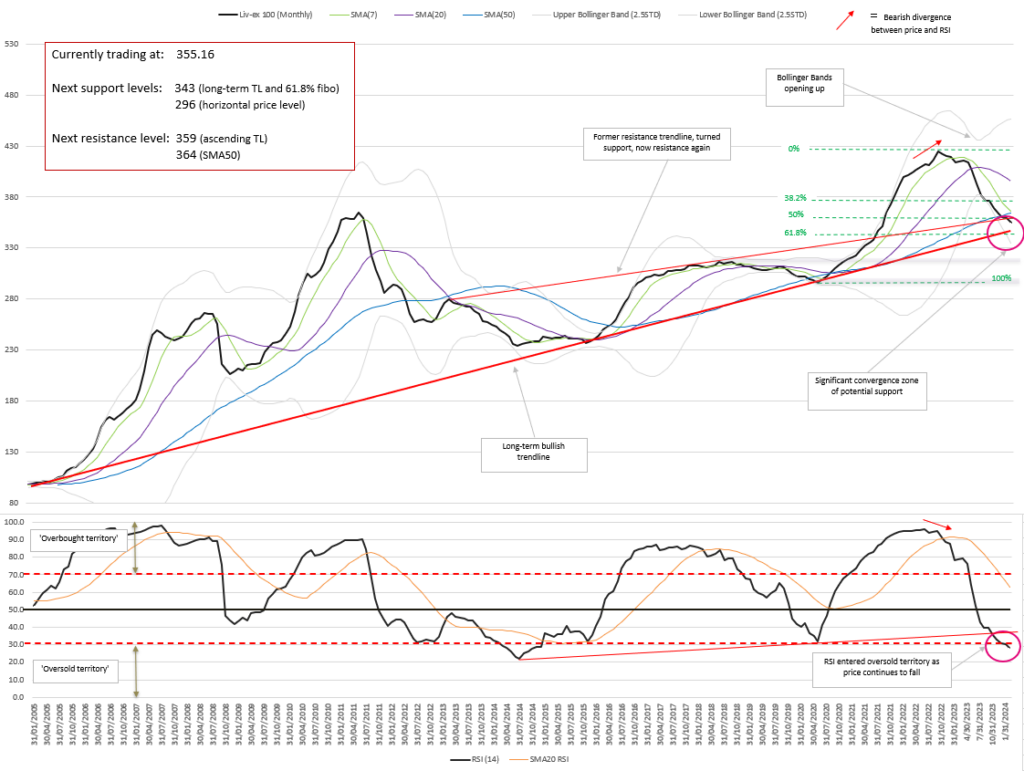
The technician notes that the index’s long-term bullish trend will be preserved as long as the Simple Moving Average 50 months (SMA50) and the rising trendlines hold.
Applying the Bollinger Bands, which are widely open, highlights volatility at present. Until the SMA50 and the two rising trendlines converge, possibly around the 500 line, there is little technical sign at this stage to suggest an imminent reversal from the current bearish momentum.
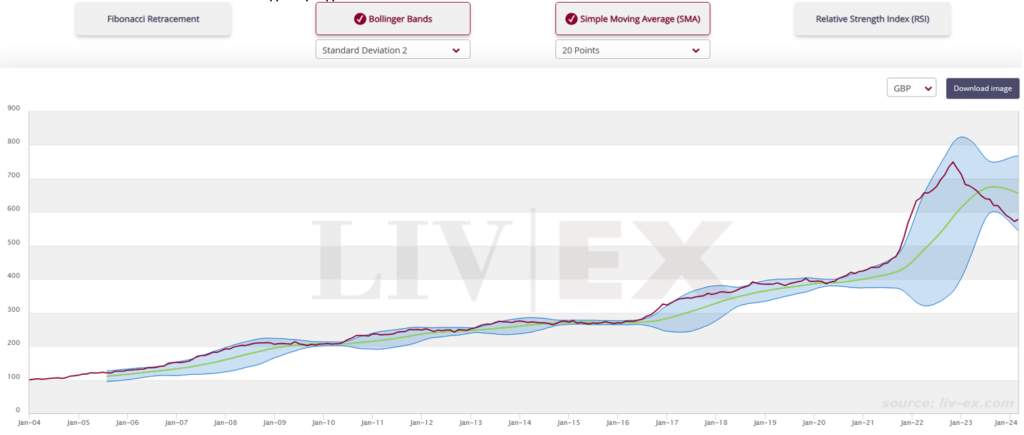
The technician recommends waiting for the Bollinger Bands to flatten before issuing a recommendation to buy the index.
As a Liv-ex member on Gold and Black package, you can use the Technical Analysis Tool to forecast future price changes and increase the probability of making more profitable trading decisions. You’ll find an explanation of the techniques and further resources (and training links) in this post; How to predict fine wine prices.