- Technical analysis considers past price performance as an indicator of future price movements.
- It aims to improve the probability of making profitable trading decisions.
- It can be applied to any liquid market with reliable data over a long enough period.
- Liv-ex data and analysis tools allow members to conduct their own analysis of the fine wine market.
Is it possible to predict fine wine prices?
Since the inception of trade, buyers and sellers have sought to predict future price movements. From Japanese rice markets and English corn exchanges to modern-day bond trading, analysts have looked for patterns in historic market data that would indicate future price movements.
Fine wine has the potential to increase in value as it improves with age and becomes scarcer. But any increase in value rarely takes place in a linear fashion; there are numerous external factors, both macro and micro in nature, that affect fine wine prices on the secondary market.
Today, with the right insight, financial market traders can identify with a higher degree of certainty how and when the market for a commodity, equity, bond or currency will change. The promised result is lower risk and more profitable trading.
Traders in fine wine can use similar analysis to make smarter decisions. This article explores technical analysis and how it can be applied to the fine wine market.
Let’s start with a definition.
What is technical analysis?
Technical analysis is a discipline which strives to predict the future direction of financial markets based on historical data. It’s an observational exercise that promises to improve the probability of success of your trading decisions.
Proponents of technical analysis believe that past price performance is the single most reliable indicator of an index’s future price movements. This is because markets are driven by human and crowd behaviour. It is people’s fears, hopes, greed and bias that set the price of anything, and technicians argue that this behaviour is consistent and utterly predictable. Technical analysts believe that once a trend is in motion, it is more likely to continue than reverse, and that history repeats itself.
The psychology of market behaviour
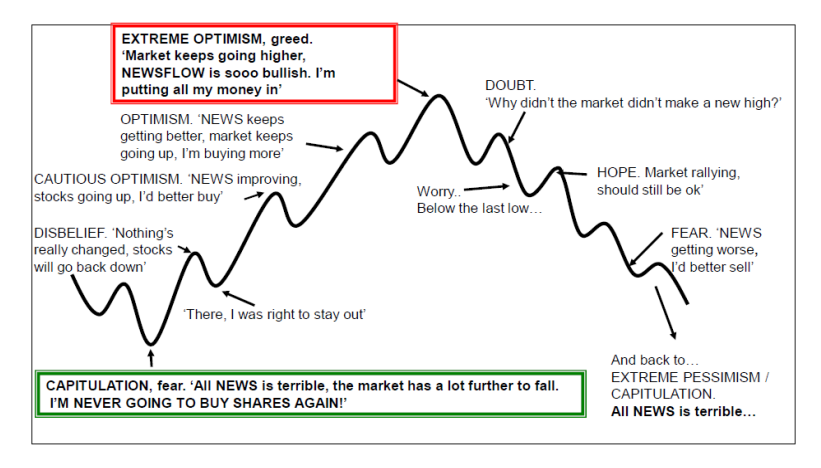
Source: Olivier Zeyssolff
In contrast, a proponent of fundamental analysis would look at macro, micro and other factors to predict supply, demand and their likely effect on future price movements. They are concerned with the ‘why?’ behind market movements.
Technicians, on the other hand, consider that it’s fruitless to try to understand an infinite number of factors, and their impact on market sentiment. In most markets, they believe that these factors are all quickly discounted in market activity, and therefore in the price. Opinions are often wrong, but markets never are! Technical analysts are thus only concerned with the effect and not with the cause itself. It’s worth noting, however, that technical analysis is frequently used in conjunction with fundamental analysis.
Technical analysts don’t claim to have a crystal ball to predict future prices. It’s no panacea. However, they do claim that by recognising repetitive patterns in a data series, they can provide reliable pointers towards the likely direction and timing of future price changes.
Can technical analysis be applied to the fine wine market?
Technical analysis can be applied to any freely traded security on a global marketplace. It works best in liquid markets and requires a reliable dataset over a sufficiently long timescale.
In January 2024, Liv-ex indices turn 20 years’ old1. They track the prices of the world’s most traded fine wines using the Mid Price between the highest live bid and lowest live offer on each wine; independent, transaction-based data that reflects the real-time activity of Liv-ex members. They include over 620 reputable wine businesses worldwide and represent the largest pool of liquidity in the world – currently over £100m of live bids and offers across 20,000 wines. Liv-ex indices are widely considered as the benchmark for fine wine prices, quoted by Bloomberg and Reuters.
For the last six months, an independent freelance technician has been applying technical analysis to this data to inform Liv-ex members. With his input, Liv-ex has developed a technical analysis tool available for members to conduct their own analysis. The tool features some of the indicators and techniques outlined below, which have the potential to help members trade fine wine more profitably.
Price, buy and sell wine smarter on the global market place for the wine trade…
Applying technical analysis to fine wine
A technician looks at a chart of prices, identifies recent trends and seeks to establish whether it will continue its current movement or reverse it (and when).
They would look to:
- Understand market conditions. Is there a new trend setting up?
- Find patterns that reflect human psychology and that suggest a price that represents value.
- Look at momentum and determine the right time to enter a market.
- Establish a trading plan with the best entry, stop loss, and profit points.
Technicians have numerous tools at their disposal to achieve this. It’s widely acknowledged that no tool in isolation will provide a signal that is 100% accurate all of the time; they are most effectively used in combination.
Ultimately, technicians are looking to spot when the price of a wine, or group of wines, is getting close to the support level at which buyers will enter the market, or the resistance level at which sellers will start selling. A support line is the line that joins the lowest low points of a charted index, and represents the price below which an asset doesn’t usually trade as buyers will always buy at that price. A resistance line joins the highest highs and represents the price above which the wine usually doesn’t trade because sellers typically start selling, which blocks further price rises. These lines can be horizontal or diagonal.
Markets usually retest these levels periodically; if the price reverses when it hits one of them, the level is confirmed. If it doesn’t, the line is redrawn at the next higher/lower level.
Will the price of First Growths rise or fall in the months ahead?
To answer this, a technician might examine the level of Liv-ex Fine Wine Investables Index over the last twenty years, and take the following steps:
- Draw horizontal lines or zones linking the index’s peaks and troughs to highlight important levels, such as the points where previous support levels have since become resistance levels (and vice versa).
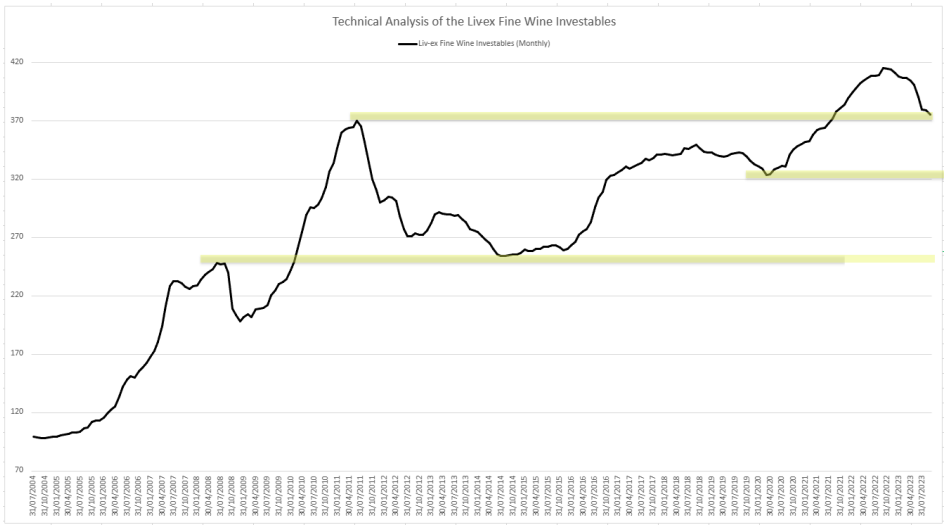
Source: Olivier Zeyssolff
- Plot trendlines to identify trends in the support and resistance levels.
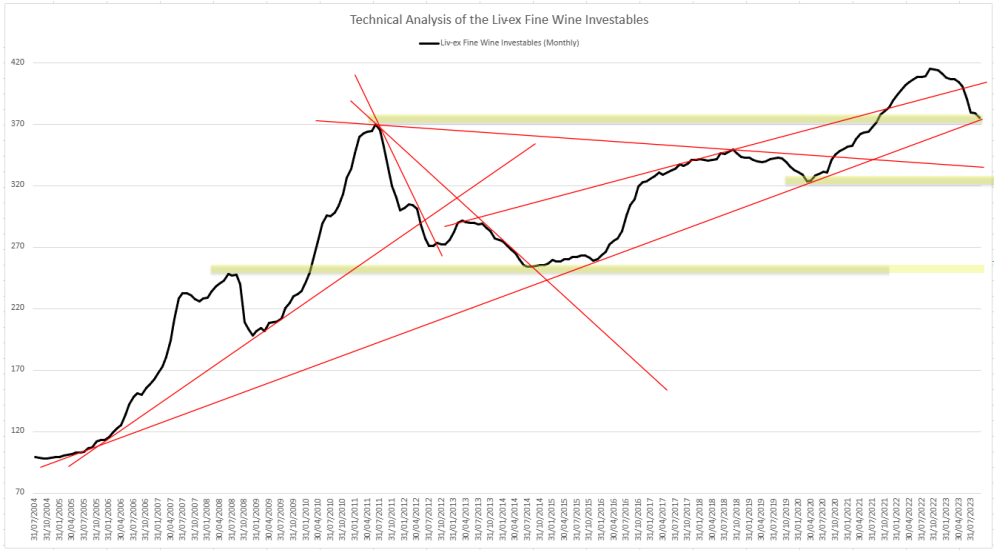
Source: Olivier Zeyssolff
Trendlines require three or more points to be drawn; two points indicate a tentative trendline. Its angle determines its strength, 45 degrees considered ‘good’. As a rule, the longer a trendline has been in effect and the more times the market has tested it, the more significant it becomes.
Technicians often put a stop-loss point when a support trendline is breached or crossed, and a profit point in the case of a resistance line. Other trendlines can also be plotted.
- Look for patterns or cycles in the market that reflect human psychology.
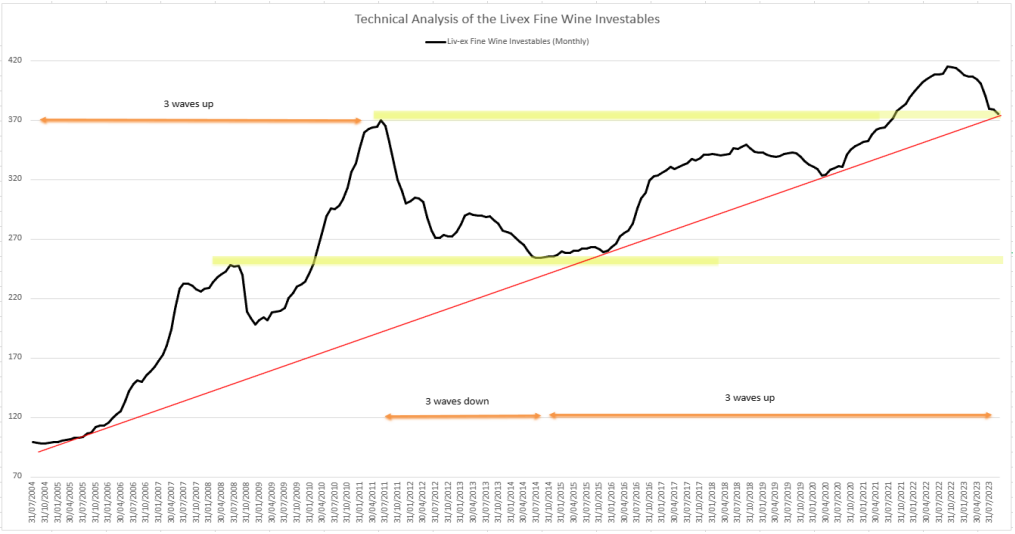
Source: Olivier Zeyssolff
These patterns might be continuation patterns like flags, triangles and rectangles. Continuation patterns indicate repetitive and predictable price movements after which the price will continue to move in the same direction once the pattern completes.
A pattern might also be a reversal which indicates a change in direction, like the one signified by the easily-identifiable head and shoulder pattern.
A technician might also identify a retracement. This is a small, temporary change in direction; a pullback after which the previous pattern should continue. But when will the retracement, or pullback, end? If human behaviour is predictable and history repeats itself, a technician might point to the naturally-occurring pattern of crowd behaviour.
- Add Fibonacci Retracements to predict the likely end of a pullback and identify a possible target level at which to take a trading position.
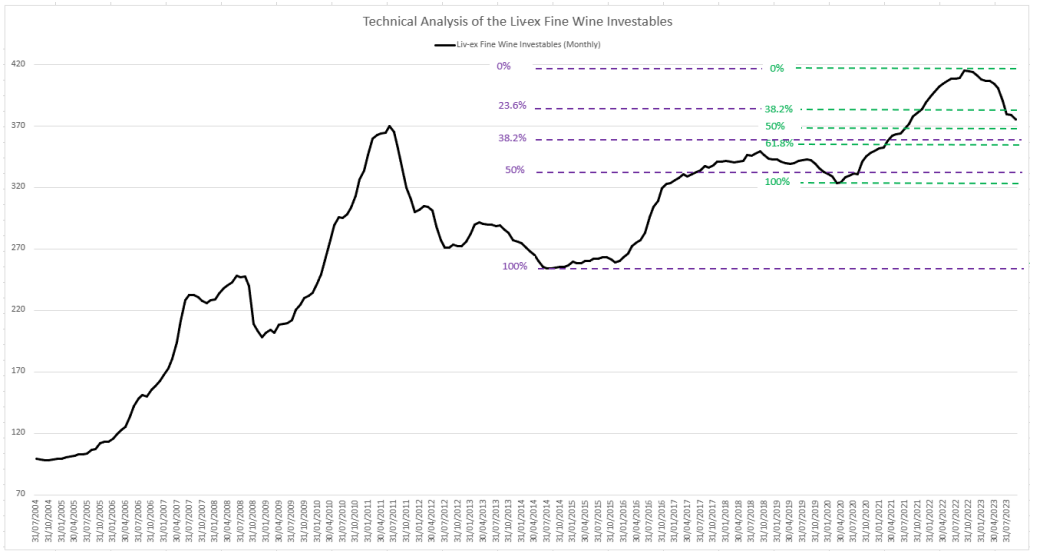
Source: Olivier Zeyssolff
The different levels reflect the golden ratio between numbers in the Fibonacci sequence. The 50% level is also commonly used, despite the fact it is not a number in the sequence. In a bullish market, retracement below the 61.8% level likely signals the end of the rally. Past evidence tells technicians that Fibonacci levels alone aren’t accurate enough indicators of future price movements; their reliability increases when they converge with other technical elements such as moving averages.
- Add moving averages to identify whether a wine or group of wines is overbought or oversold.
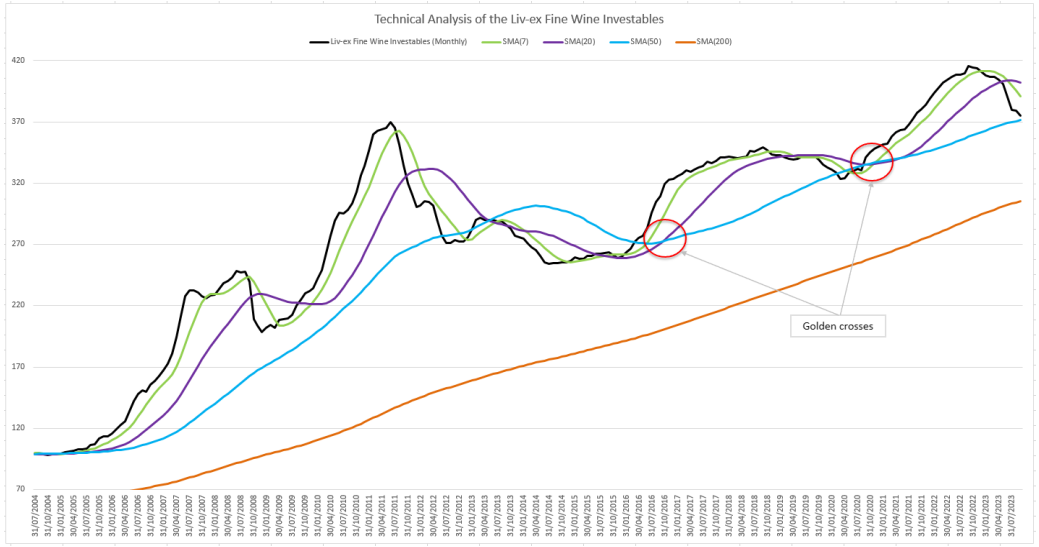
Source: Olivier Zeyssolff
Simple Moving Averages (SMAs) are used to smooth out volatility in price trends and indicate whether a price is likely to continue or to reverse a bull or bear trend. They can be set over any timeframe; or example, the SMA50 can be the rolling average price over the last 50 days, weeks or months depending on the units chosen for the analysis. Two popular trading patterns occur when the SMA50 moves below the SMA20 (a death cross), and when a short-term SMA moves above a longer-term SMA (a golden cross).
- Add Bollinger Bands to establish how volatile prices are at present.
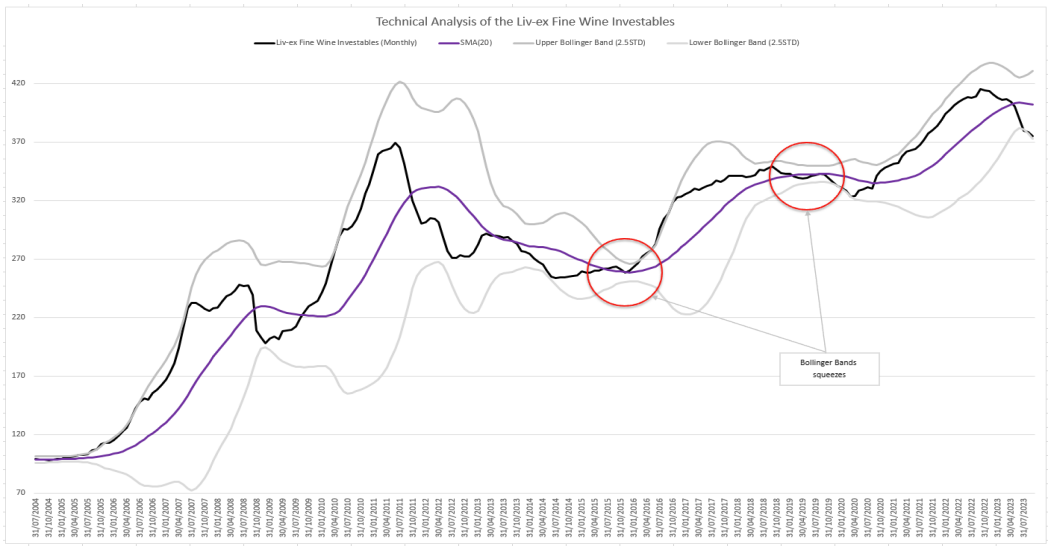
Source: Olivier Zeyssolff
Bollinger Bands are two lines on either side of the SMA20, calculated using standard deviation. The bands widen when prices are more volatile and narrow when they are less so. When the gap between the bands is small, a technician would expect volatility to soon increase, and vice versa. Bollinger Bands help technicians recognise both the continuation or the reversal of trends.
- Chart the Relative Strength Index (RSI) to assess momentum that would indicate whether a wine is (or is heading towards) being overbought or oversold.
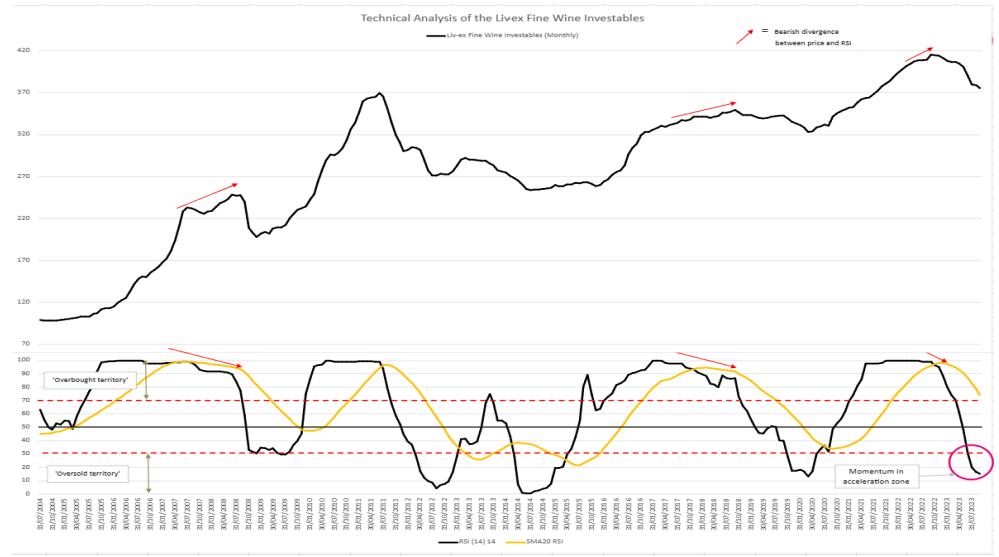
Source: Olivier Zeyssolff
The RSI is displayed as an oscillator that shows a security’s average gains or losses over a given period. It measures the magnitude of directional movement on a scale of 0-100. Traditionally, a reading of 70 or above indicates that a wine is overbought, and below 30 indicates that it is oversold. If the RSI moves beyond 60 or 40 respectively, it is taken to mean that price momentum is accelerating, and that a market shift could be ahead.
When they are pulled together, a technician would look for multiple indicators that are converging. This would signal that players in the market are about to change their behaviour.
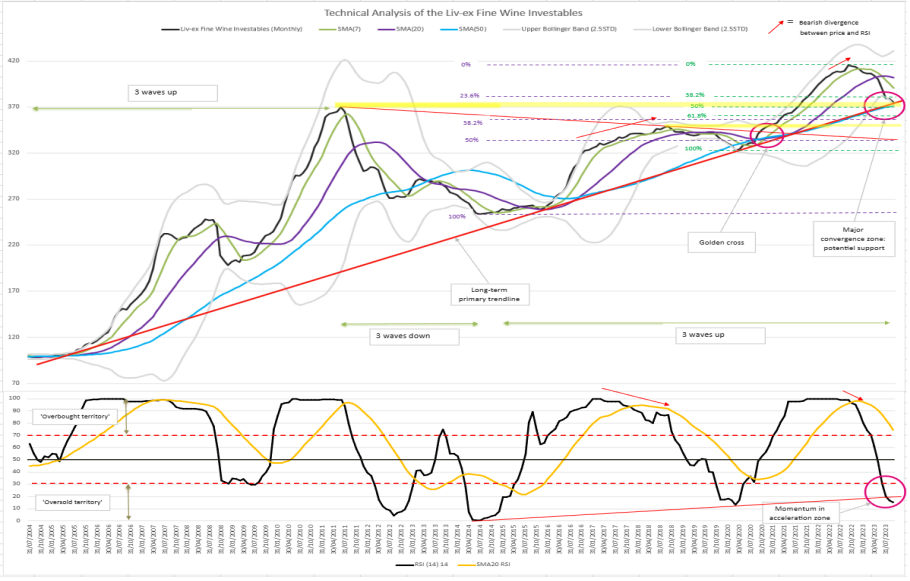
Source: Olivier Zeyssolff
This behaviour change would trigger a price movement that technicians claim to be able to predict.
If applied consistently and intelligently, technical analysis can improve the profitability of a trader.
The more proponents of technical analysis there are in the fine wine market, the more reliable these indicators should be in the future, as more traders take positions on the most heavily traded wines on the market.
Investopedia evaluates and recommends courses on Technical Analysis, while also offering its own. Find out more here.
Liv-ex membership is open to all reputable wine businesses. Not yet a member? Request a demo on the form below.
Liv-ex analysis is drawn from the world’s most comprehensive database of fine wine prices. The data reflects the real time activity of Liv-ex’s 620+ merchant members from across the globe. Together they represent the largest pool of liquidity in the world – currently £100m of bids and offers across 20,000 wines.