What is technical analysis?
Technical analysis is a discipline for predicting the future direction of financial market prices based on historical data. It can be applied to all liquid markets, including fine wine. For a deep-dive into Technical Analysis, you can read our blog post “How to predict future wine prices”.
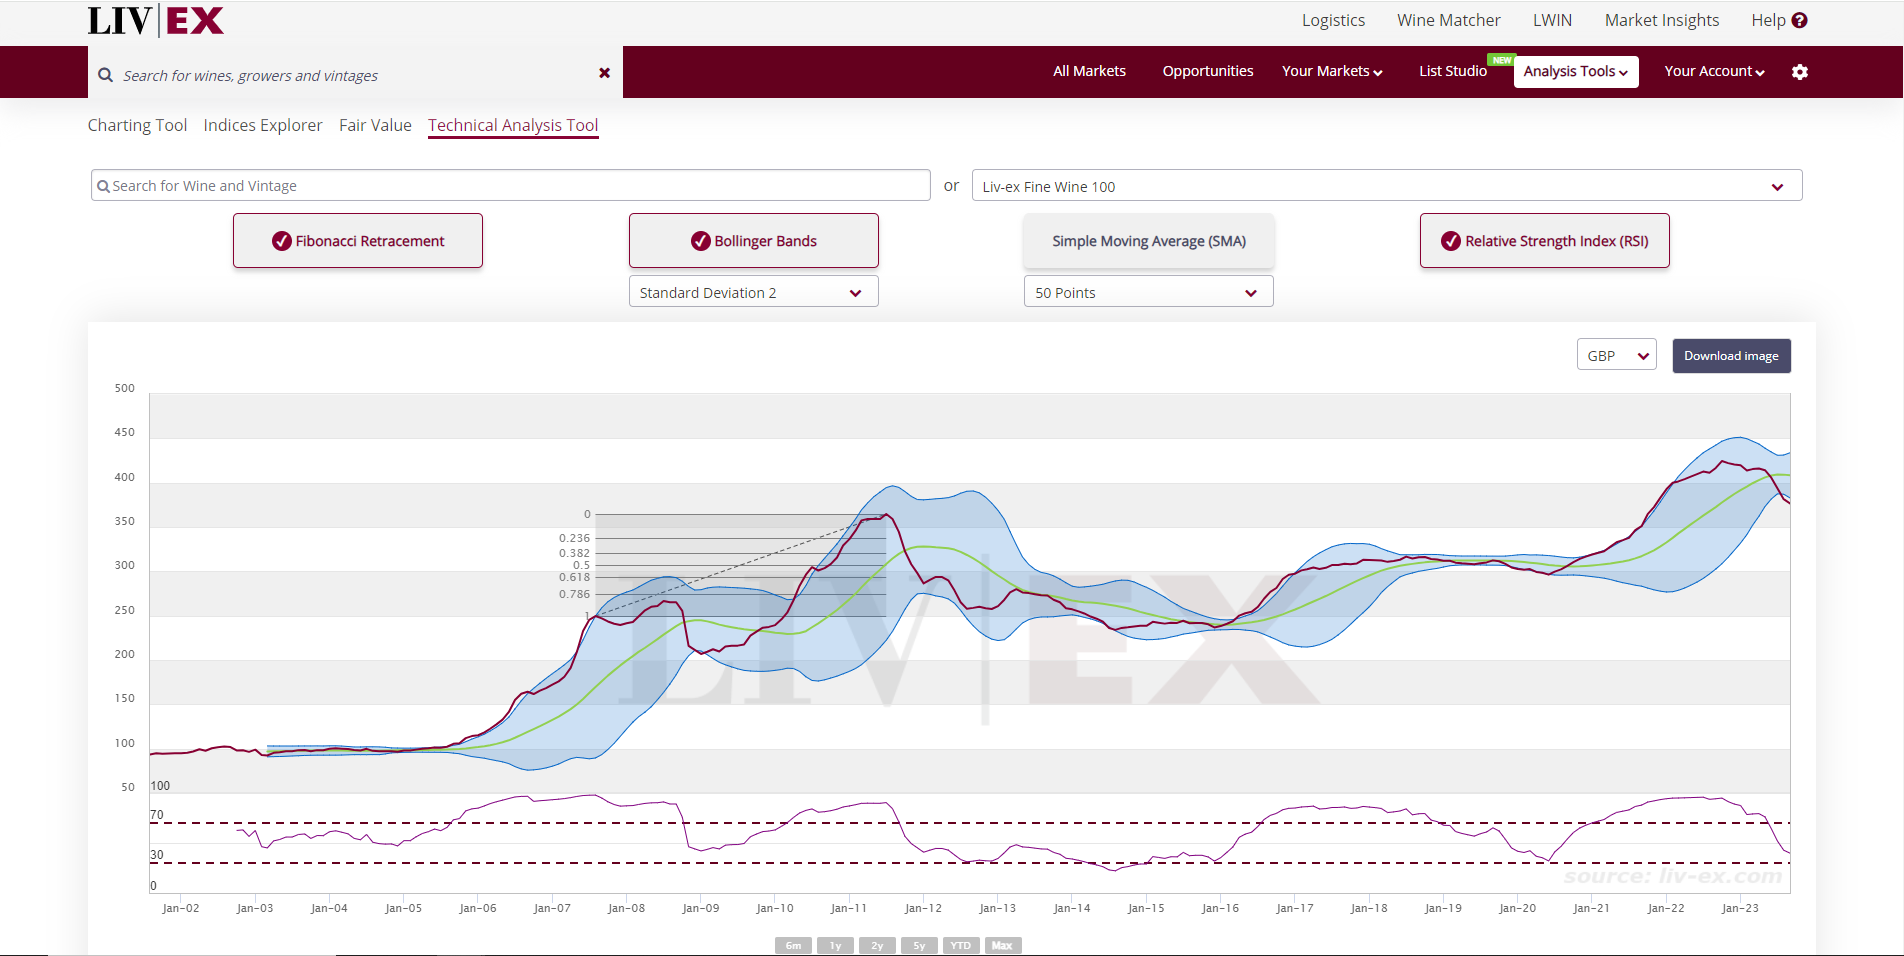
How can I use the Liv-ex Technical Analysis Tool?
Members can perform technical analysis on wines (LWIN11s) and Liv-ex indices, using four different financial indicators:
- Fibonacci Retracements
Predict the likely end of a pullback and identify a possible target level at which to take a trading position. - Bollinger Bands
Establish how volatile prices are at present, and recognise both the continuation or the reversal of trends. - Simple Moving Average (SMA)
Indicates whether a price is likely to continue or reverse a bull or bear trend. - Relative Strength Index (RSI)
Measures the magnitude of directional movement, based on average gains or losses over a given period.
These can be applied separately or used together. You can also download the charts you create and show them to clients.
Want to see more?
If you want to find out more, we would be happy to show you the Technical Analysis tool in action. Please fill in the form below and a team member will be in touch.