June Market Report
Share this article | Print this article
- All the major Liv-ex indices fell in May
- Barsac wines among the biggest risers in the Liv-ex 1000 in May
- What does Pétrus winning a high-profile court case mean for its secondary market performance?
- A look back at Neal Martin’s Bordeaux scores over the past 17 years
- The En Primeur 2022 campaign so far
- Technical Analysis of the 2009 and 2010 vintages of Pontet-Canet
A month of contradictions
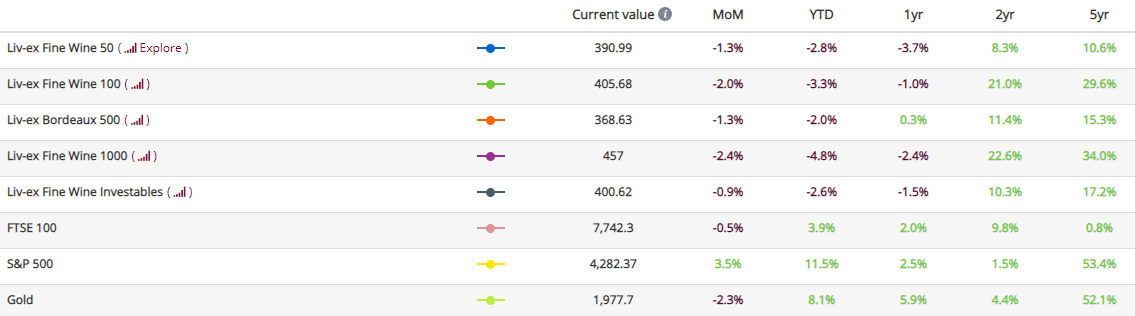
*data taken on the 5th of June 2023.
All major Liv-ex indices fell in May. The broadest measure of the secondary market, the Liv-ex Fine Wine 1000, experienced the biggest decline, falling 2.4% to close at 457. The Liv-ex Fine Wine 100 (the industry benchmark) was down 2%, and the Liv-ex Fine Wine 50 (which tracks the movement of First Growths) fell by 1.2%.
Interestingly, despite these negative movements, trade was up by value and volume on Liv-ex last month. The breadth of the market also improved slightly month-on-month, with 1,864 individual labels (LWIN11s) traded on the platform.
These numbers suggest that Market Prices are falling across the board, rather than trade activity. Indeed, of the 100 wines that make up the Liv-ex Fine Wine 100, 79 saw their prices fall in May, with just 21 risers.
These declines are quite contrary to the picture painted by the En Primeur 2022 campaign so far, where release prices are up more than 15% on average year-on-year. As a result, appetite for some of these new wines is limited and some buyers are turning to back vintages for value; you can read more in the section of the report summarising the En Primeur campaign so far.
Is the 2022 campaign struggling as a result of this difficult market, or are the exorbitant prices put up by Bordeaux further entrenching the feeling of risk aversion that is widely felt among the trade? Only time will tell.
Major Market Movers – Barsac
As stated in our recent blog post, the Liv-ex 1000 is down 2.4% month-on-month, its largest decrease in the past seven months. Despite this, some regions are seeing success.
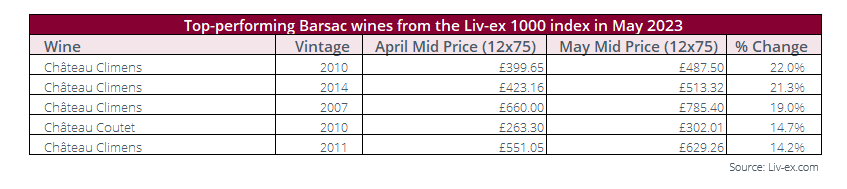
In May, Barsac was a standout performer, with five wines among the top ten biggest risers in the Liv-ex 1000. Below is a table showing these wines and the percentage increase in their Mid Price month-on-month.
* All Liv-ex indices are calculated using our Mid Price; the mid-point between the highest live bid and lowest live offer on the market. These are the firm commitments to buy and sell at that price; transactional data rather than list prices. It represents the actual trading activity of 620 of the world’s leading fine wine merchants. Because Liv-ex doesn’t itself trade, this data is truly independent and reliable.
Interestingly, four of the five best-performing wines from Barsac were back vintages of Château Climens: the 2010 vintage was up 22.0% month-on-month, the 2014 up 21.3%, the 2007 up 19.0% and the 2011 rose by 14.2%.
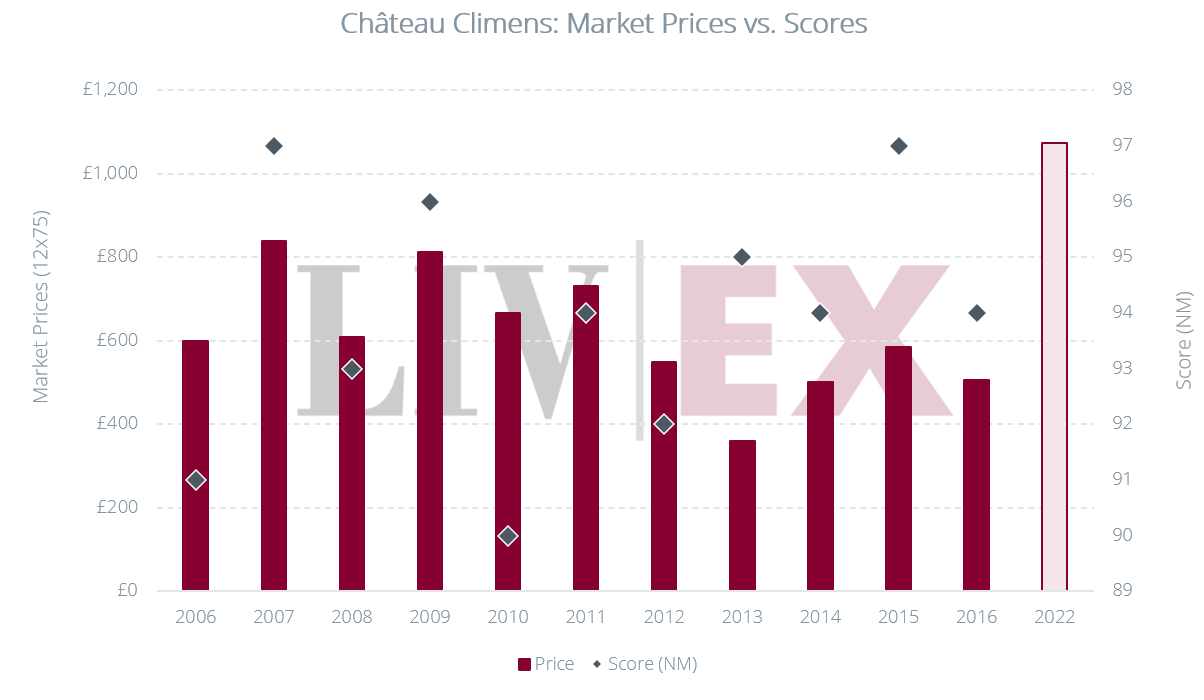
This success in Climens back vintages could be attributed to the very high price of the 2022 release. The wine was released with a recommended retail price of £1,340.40 per 12×75, up 139.4% from the opening price of its previous release in 2016. The estate did not produce any wine in 2017, 2018 nor 2021 due to challenging weather conditions, which may go some way in explaining the large increase in price.
The last wine in the top five was Château Coutet 2010, whose Mid Price was up 14.7% in May.
Critical Corner
Neal Martin’s impact on Market Prices and value opportunities in Bordeaux
When Liv-ex members were asked which of the critics would impact their Bordeaux En Primeur buying decision the most this year, Neal Martin (Vinous) topped the rankings once again. Martin recently released his Bordeaux 2022 scores and tasting notes, in which he identified three exceptional wines, which he referred to as ‘snow-capped peaks’ with the potential for ‘perfect scores’.
The chart below shows the average Market Prices of 57 leading Bordeaux wines, as well as their average Neal Martin scores. For 2022, the average release price of these wines is plotted, and the three markers represent the average of the lower and higher bounds of the barrel range scores Neal Martin awarded the wines, as well as the average score in grey.
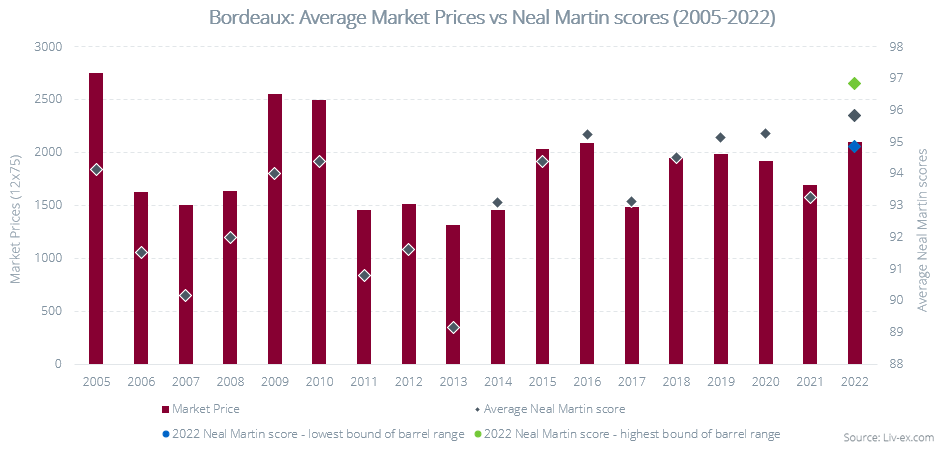
As Neal Martin is considered the most respected En Primeur critic, it would be expected that vintages with high scores would all be associated with higher Market Prices. This trend is evident in vintages such as 2005, 2009 and 2010.
However, not all back vintages follow this pattern and instead, some have higher Market Prices despite lower scores in comparison to more recent vintages. These instances align with the traditional pricing pattern for fine wines, by which they tend to appreciate in value with age. As such, some of the more recent vintages from the last few years offer relative value against older, more prestigious ones – and they are also more widely available to buy.
For example, the oldest vintage in our comparison, 2005, has an average Neal Martin score of 94.12 points and the highest average Market Price of all the wines we compared (£2,735 per 12×75). 2016, on the other hand, has the highest average score of 95.24 points but comes at a lower average Market Price of £2,105 per 12×75. Consequently, wines from 2016 are on average 23% cheaper than 2005 wines, making the vintage an attractive one to purchase. It’s worth noting, however, that 2005 benefits from nine more years in bottle and that its wines are entering their drinking window.
Those looking for value could also consider the 2020 and 2019 vintages. They have average Neal Martin scores of 95.14 points and 95.23 points respectively – just shy of the 2016 – and offer an average discount of 9% and 5% to that vintage. 2020 wines are also higher rated on average than wines from the 2009 and 2010 vintages, and available at a discount of 24% and 25% to those older years respectively.
The 2013 vintage stands out with the lowest average Neal Martin score of 89 points and perhaps not surprisingly the lowest average Market Price of £1,320 per 12×75, but subsequent vintages show a rebound with higher scores and increasing average Market Prices. Notably, the 2018, 2019 and 2020 vintages consistently surpass the overall average Market Price, accompanied by higher overall average Neal Martin scores. This could be due to increasingly limited supply as volumes harvested, produced and released have dwindled in recent years, or perhaps an improvement in winemaking techniques leading to higher critic scores.
Despite their reputation as lesser Bordeaux vintages, 2017 and 2021 still boast average Neal Martin scores of 93.11 and 92.25 (lower than their peers but nonetheless very respectable). As such, they still offer potential value with an attractive average Market Price of £1,520.12 and £1,714.30 respectively – a discount of 28% and 19% in comparison to the top-scoring 2016 vintage.
With an average Neal Martin score of 95.84 points, it will be interesting to observe the pricing patterns of the 2022 vintage. Currently, it is on average better rated than the 2016, 2019 and 2020 – but depending on whether it tends towards the lower or higher bracket of the barrel ranges awarded by the critic, that may well change.
The Bordeaux En Primeur 2022 campaign so far: All quiet on the Western Front
The campaign so far has been a little pedestrian. Only 25% of the top wines have been released. With summer just around the corner, we can expect the pace to quicken considerably over the next four weeks.
As we suggested in our opening report, pricing is a crucial issue for Bordeaux this year – the market is soft, the macroeconomic storm clouds have not dispersed. If there is any insight to be gained from the releases so far, it is that buyers won’t buy the 2022 vintage at all costs, no matter how critically-acclaimed it is.
Indeed, feedback from UK merchants so far is that the volume sold is down not only on 2020, but even on 2021 for some. To many of their private collectors, the prices simply don’t make sense. Discounts are being offered in order to get deals done. Only a handful of the releases to date have sold through.
The story is much the same in Asia, with merchants suggesting their clients are drifting further away from the whole idea of En Primeur. The average returns and the idea of waiting two years for stock to arrive are increasingly unappealing to collectors who can have back vintages delivered almost instantly at a discount to the current release. Merchants are thus buying more selectively, caught between pushing back on rising prices and maintaining good relationships with négociants whom they rely on for allocations.
Campaign pricing analysis
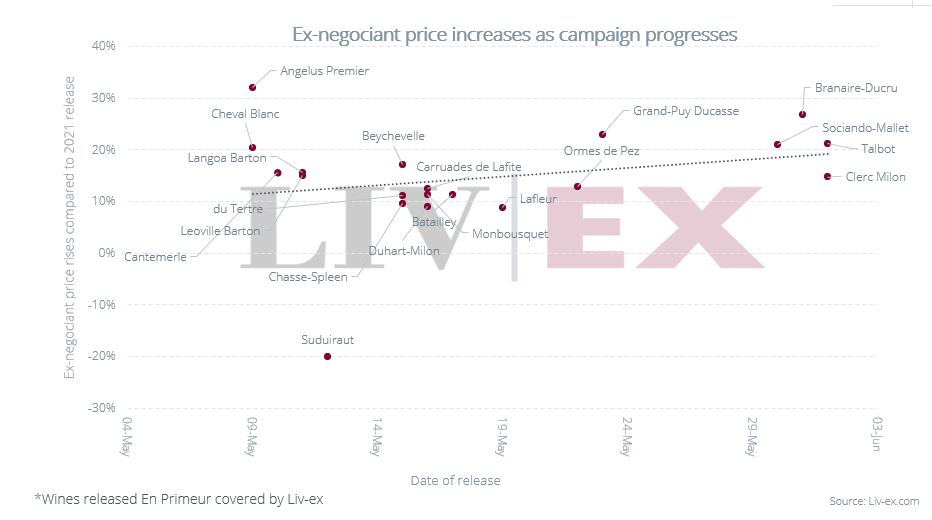
Analysis of the pricing of the wines released so far reflects market sentiment surrounding the campaign. We considered 111 wines released as of Thursday 1st of June. Overall, the wines’ ex-négociant prices increased by 11.5% on average from 2021 to 2022; their UK release prices showed an even higher overall average increase of 15.6% due to the weaker Sterling.
Liv-ex members were polled ahead of the campaign and asked what they expected the prices in 2022 to be – their estimated 7.7% increase year-on-year has proved conservative.
96 of the 111 wines analysed in our dataset saw their ex-négociant price go up year-on-year, averaging a 13.7% increase. Among them, L’Extravagant de Doisy Daëne experienced the highest price increase, more than doubling its ex-négociant price (+108%).
In contrast, only five wines saw a decrease in their ex-négociant price (down 9.5% year-on-year on average). Notably, Château Suduiraut had the most significant drop, with a 20% decrease in its ex-négociant price and an 18.4% decrease in its opening price.
The chart below shows the wines covered by Liv-ex released so far along with the percentage change in their ex-négociant price year-on-year. The rising trendline shows a gradual increase in price rises as the campaign progresses, which hints that this upward movement might be set to continue.
If there is value, there is appetite
But it’s not all doom and gloom. The estates that have read the room and released sensibly are reaping the rewards of their pricing strategy. Cheval Blanc, Léoville Barton, Langoa Barton, Carruades Lafite and Beychevelle have sold through with most merchants.
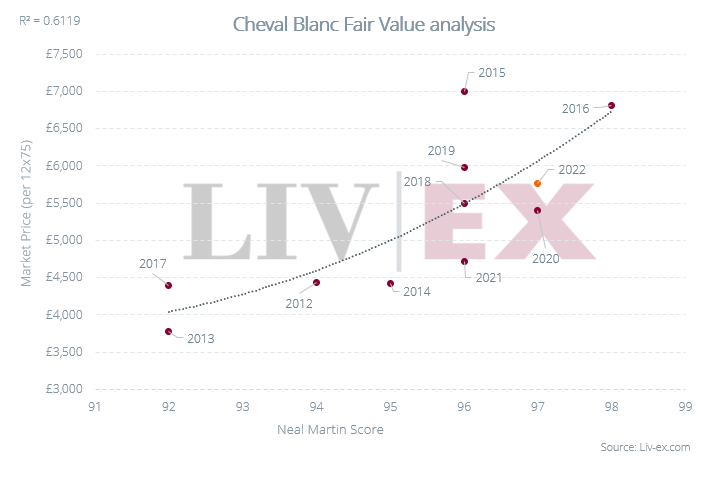
Using Liv-ex’s Fair Value Tool, members can assess newly-released wines against their back vintages, to see where they might find relative value. The Market Price of Cheval Blanc, for example, is strongly correlated to Neil Martin scores (61.2%). The chart below shows that while the 2022’s release price was up 21.52% year-on-year, the wine still offers relative value compared to previous vintages.
It remains to be seen whether Châteaux will listen to buyers and make the most of a market that does want to buy wine, just at the right price.
Liv-ex Bordeaux 2022 En Primeur coverage
Liv-ex is publishing release posts for over 100 wines and boasts a range of tools and insights to help you navigate the En Primeur campaign. Our Bordeaux 2022 page contains links to key prices, critic scores, and reports and release blogs.
You can sign up to receive email alerts whenever analysis is published to avoid missing out.
Chart(s) of the month
Technical Analysis of Château Pontet Canet 2009 and 2010
What is technical analysis?
Technical analysis is a method of forecasting future movements by looking back – the theory being that historical trading activity can be a valuable indicator of its future price movements. This month, the technical analysis section of the report is a bit longer and more advanced than usual, which we hope will please members who are well-versed on the topic.
Many among the trade are lauding the quality of the 2022 vintage, putting it on a par with 2009 and 2010. Ahead of the release of Château Pontet Canet 2022, this month we will be comparing the price action of its 2010 and 2009 vintages.
Since the early drop immediately after its release in 2010, the price of Pontet Canet 2009 has gone through three main phases: a sharp impulse upwards from 2010, followed by a prolonged consolidation period from early 2012, and another impulsive move up from March 2020. Since mid-2022, the price has been consolidating again but has remained firmly above the tentative primary bullish trendline, as well as the accelerating trendline from March 2020.
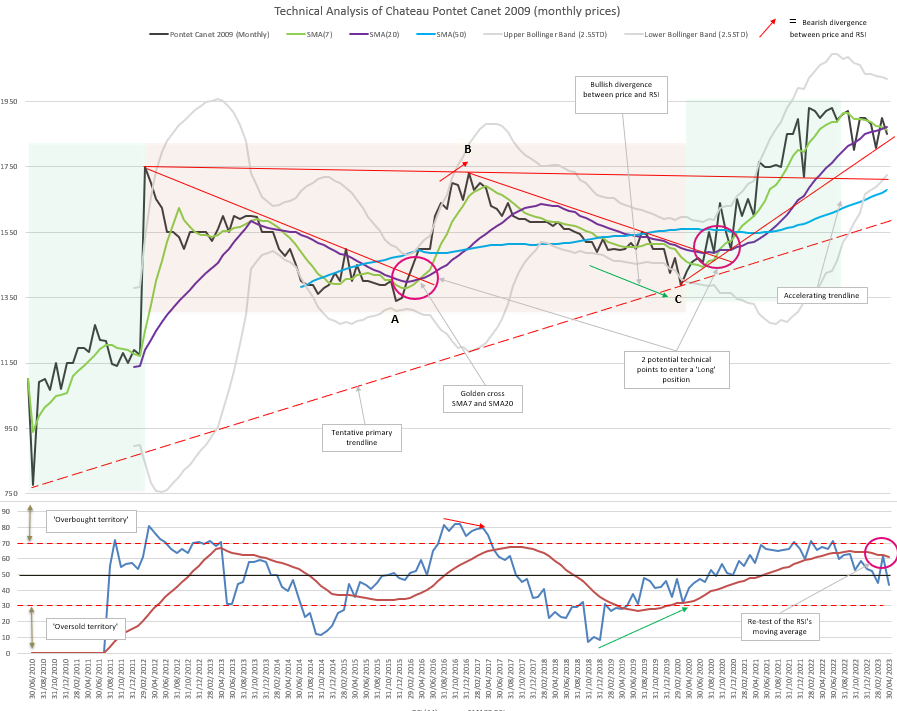
From early 2012 to March 2020, the price evolved into a long-term consolidating range with clear resistance at around 1,750 and support at around 1,350. Price failed to make a new high in early 2017 and created a potential ‘double top’. While Bollinger Bands (BB) were widely opened, we note the bearish divergence between the price (rising at the end of 2016) and the Relative Strength Index (RSI), which not only was overbought (i.e. over the 70 level) but also declining, albeit moderately.
Since the price peaked in March 2012, Pontet Canet 2009 remained in a corrective phase until March 2020. Following the Elliott Wave Theory, corrections typically break down into three main waves to form a zigzag, also known as a ‘flat’ or a ‘triangle’: wave A goes down, wave B retraces slightly, and wave C concludes the correction. Here the retracement of wave B was extremely deep, while the falling wave C was almost of the same amplitude as wave A. We can therefore call this correction pattern a ‘regular flat’.
Pontet Canet 2009 reached a high of 1,930 in June 2022 following a two-year climb. Since then, the price action has been choppy and bouncing off the SMA7 and SMA20. The price is currently below both SMAs but remains supported by a rising accelerating trendline. The BBs are beginning to close and the RSI is now firmly below the ’50 line’ following a perfect re-test of its own SMA20. Based on the price action and the indicators at the end of April 2023, we would expect a further decline.
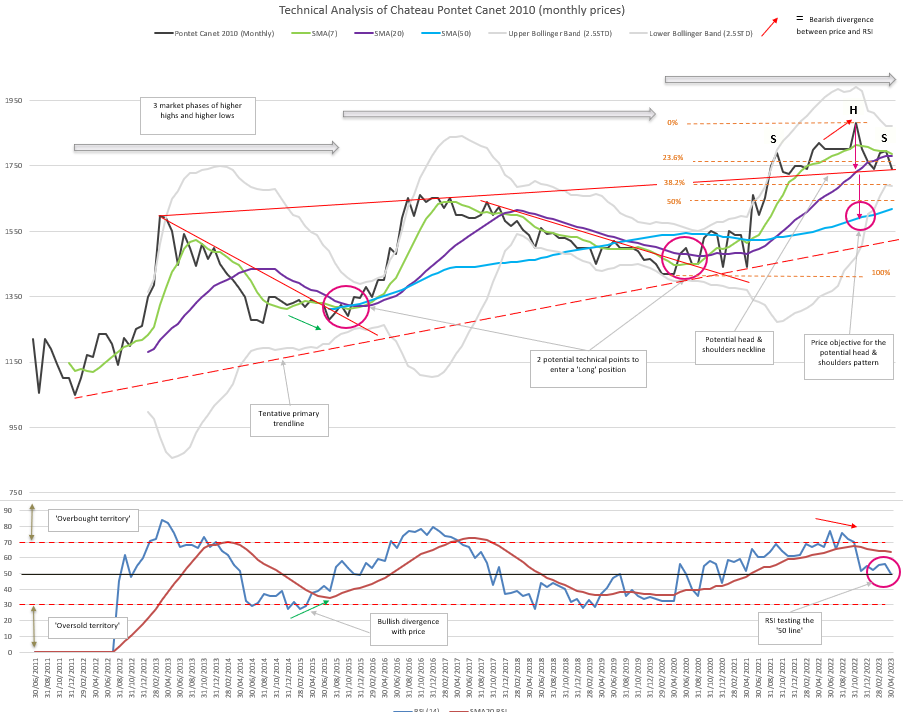
As with the 2009, we can see three distinct phases in Pontet Canet 2010. The main difference is that the 2010 displays higher highs and higher lows in all three market phases (unlike the 2009 which had a protracted consolidation phase between 2012 and 2020).
Pontet Canet 2010 reached a first major high 21 months after its release, as did Pontet Canet 2009. The second major high was achieved 67 and 65 months after release for Pontet Canet 2009 and 2010 respectively – but 2009 did not surpass its previous high. The latest rise started in March 2020 for both wines and reached a peak towards the end of 2022.
Both prices are supported by a rising tentative trendline (tentative because there are, for now, only 2 points of contact), evidencing the long-term bullish trend for both wines. It is noteworthy that the angle of this potential trendline is less steep for Pontet Canet 2010.
Additionally, the retracements following the price tops in March 2013 and October 2016 are fairly deep (at 60% and 61% for Pontet Canet 2010, very close to the Fibonacci retracement level of 61.8%). While the retracement is deep in March 2020 for Pontet Canet 2009, the first correction is much shallower.
The Relative Strength Index (RSI) is also showing more volatility for Pontet Canet 2009, and spent more time in oversold territory than the RSI of Pontet Canet 2010, which hardly ventured into oversold territory.
Pontet Canet 2010’s Bollinger Bands (BBs) are currently being squeezed tighter, which could mean that its price might remain in a range for the coming months. However, should the price break below the neckline, the head and shoulder pattern would be validated, providing a short-term ‘Sell’ signal, and come with an objective just below 1,600 (100% of the distance from the top of the head to the neckline reported below the neckline).
A break would also signal that a correction is truly underway. Based on the two previous market phases, and if the past is any indication, the price could again retrace around 61.8% of the increase from April 2020 to October 2022, which would take the price to 1,595 and converge with the head and shoulders’ price target.
Invalidation of the short-term trade:
- The more aggressive sellers will put a ‘stop loss’ just above the level of the right shoulder, and in any case above the 7-month Moving Average (SMA7).
- The more conservative sellers will place their stop loss just above the all-time high price.
The long-term bullish trend remains intact at the time of writing. It would look more vulnerable if the price broke below the SMA50, but more importantly if it broke below the long-standing ascending tentative trendline that would then be validated. We will be monitoring whether the RSI of Pontet-Canet 2009 breaks below 30-40 levels, which would likely accelerate the downward trend.
Liv-ex analysis is drawn from the world’s most comprehensive database of fine wine prices. The data reflects the real time activity of Liv-ex’s 620+ merchant members from across the globe. Together they represent the largest pool of liquidity in the world – currently £100m of bids and offers across 16,000 wines.