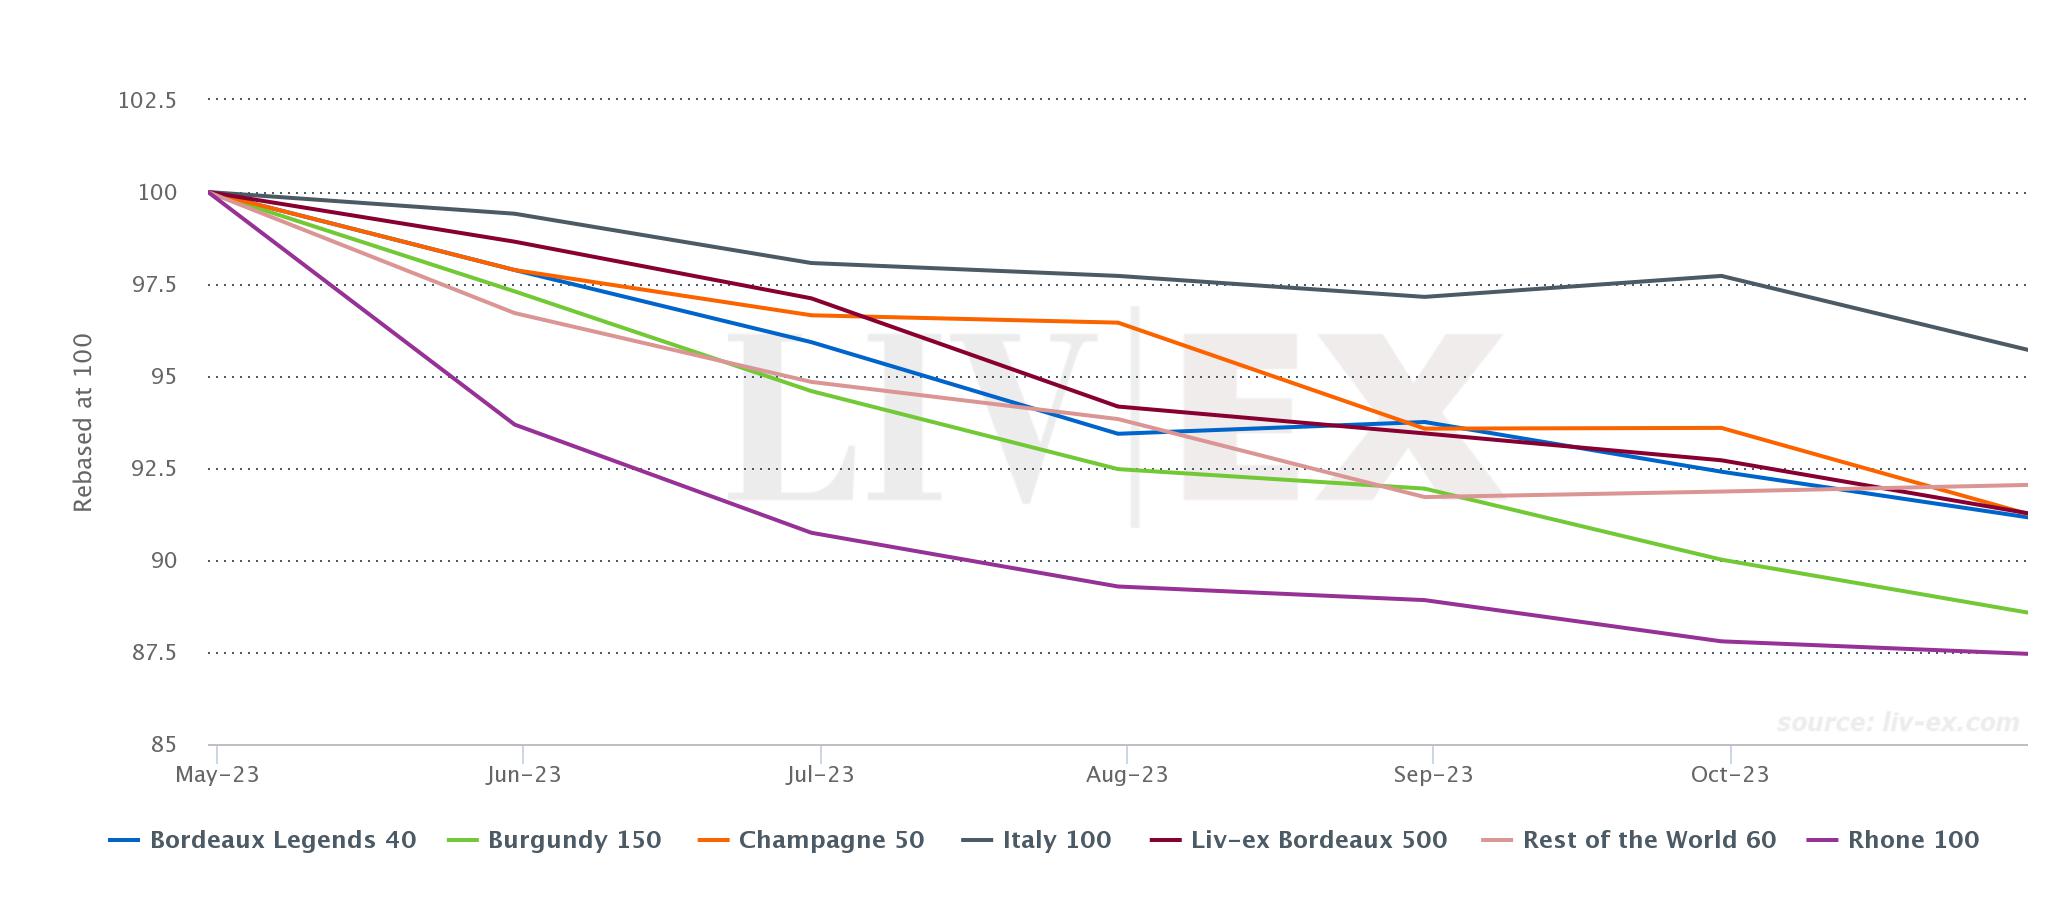
- The Liv-ex 1000 experienced a sharper decline of 1.4%, an acceleration compared to the previous month. Year-to-date, all of its sub-indices are down.
- The Champagne 50 recorded the most substantial decline in October, falling by 2.5%. Meanwhile, the Rest of the World 60 is the only sub-index that rose month-on-month.
*made using the Liv-ex Charting Tool.
Last month, the volatility across different indices and the positive movements recorded by some hinted at the possibility of the market finding a bottom. However, October ruled that out for now, as the Liv-ex Fine Wine 1000 experienced a steeper decline of 1.4% compared to the 1.0% decline recorded in September and August.
Both Liv-ex Fine Wine 100 (the industry benchmark) and the Liv-ex Fine Wine 50 (which tracks the movement of First Growths) also experienced deeper drops in October, with monthly decreases of 2.1% and 1.9% respectively. These negative shifts underscore the market’s ongoing caution within the downward trend.
While wines in the Liv-ex 100 traded at an average of 3.05% below their Market Price compared to just 1.73% below in September, within the Liv-ex 1000, this figure shifted from 3.19% below Market Price in September to 2.55% in October.
Trading value increased in October, as did the number of monthly transactions on the exchange. Market breadth is steadily expanding, with 2,243 individual labels (LWIN 11s) trading on Liv-ex last month. Last week was the third highest in terms of number of transactions and active traders this year, signalling that buyers are taking advantage of the record amount of offers available on the exchange, and that some sellers are adjusting to lower prices.
Rest of the World 60: The only sub-index on the rise
*made using the Liv-ex Charting Tool.
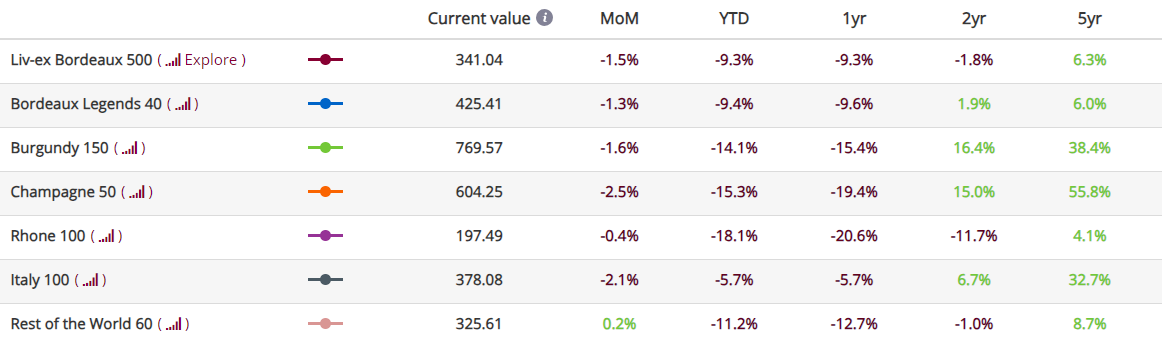
Year-to-date, all sub-indices of the Liv-ex 1000 have recorded declines; month-on-month, all but one of them are in the red. The Rest of the World 60 has shown growth for the second consecutive month, increasing by 0.2% in both September and October. This positive trend is largely driven by California, with 20 out of the 30 Californian wines in the index either increasing in value or remaining stable over the month. The most active wines in the Rest of the World 60 were the 2018 and 2019 vintages of Opus One, as well as Screaming Eagle 2012 as well as several vintages of Seña.
On the other hand, the Champagne 50 recorded the most significant decline this month, dropping by 2.5% after remaining flat in September. Its year-to-date decline is just behind the Rhône 100, having dropped by 15.3%. Italy remains the most stable sub-index year-to-date, with a decline of 5.7%.
Technical Analysis of the Liv-ex Fine Wine 1000
What is technical analysis?
Technical analysis is a method of forecasting future movements by looking back, the theory being that historical trading activity can be a valuable indicator of its future price movements.
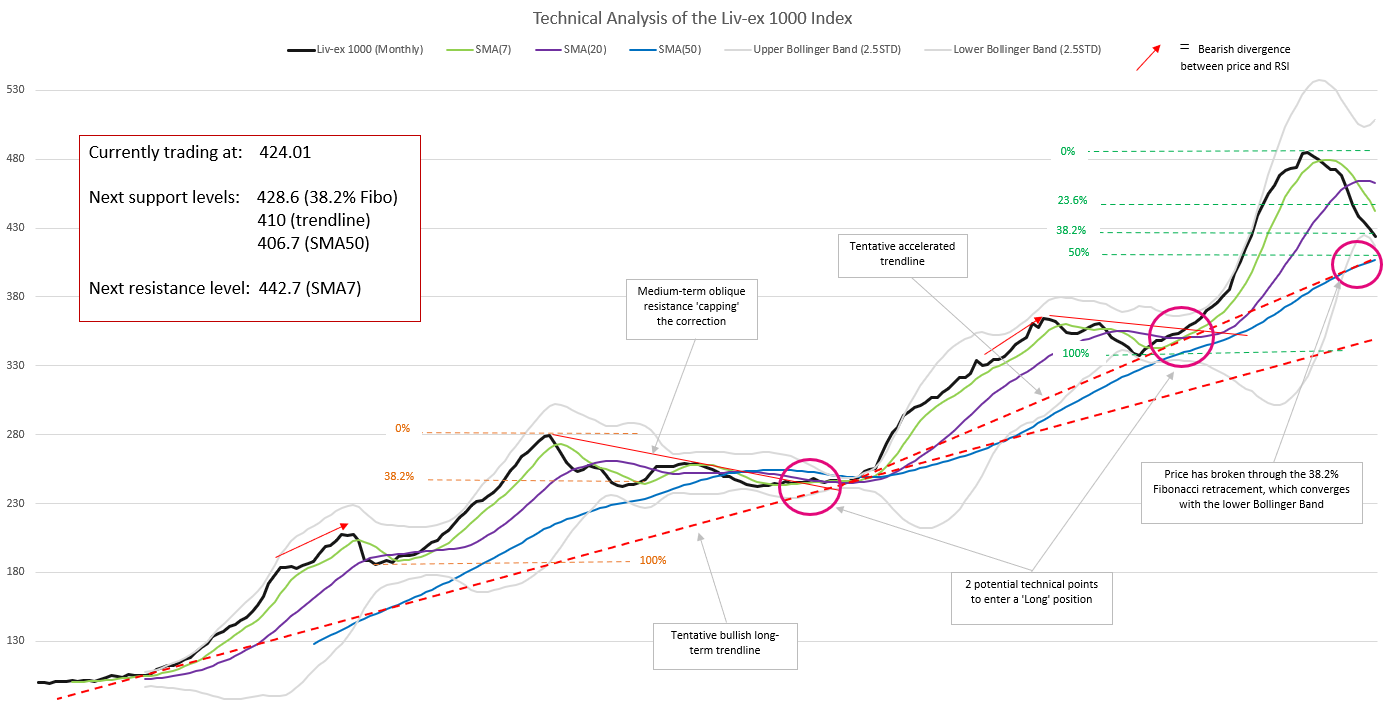
The Liv-ex 1000 index closed at 424.01 at the end of October, below its 7-month and 20-month Simple Moving Averages (SMAs). While it was testing its 38.2% Fibonacci retracement level, as discussed in last month’s analysis, it has now broken through it. The coming months could see it keep falling and breaking through the next level, the 50% retracement, or rebound off it, reversing into its long-term bullish trend. Generally, proponents of technical analysis consider that a retracement of more than 61.8% indicates the end of the rally in a bullish trend. The main support zone we will be monitoring is the convergence point of the SMA50 and the tentative accelerated trendline at 406.7.
The Bollinger Bands (BB) have opened up further, the price following the lower band down confirming the return of volatility to the downside.
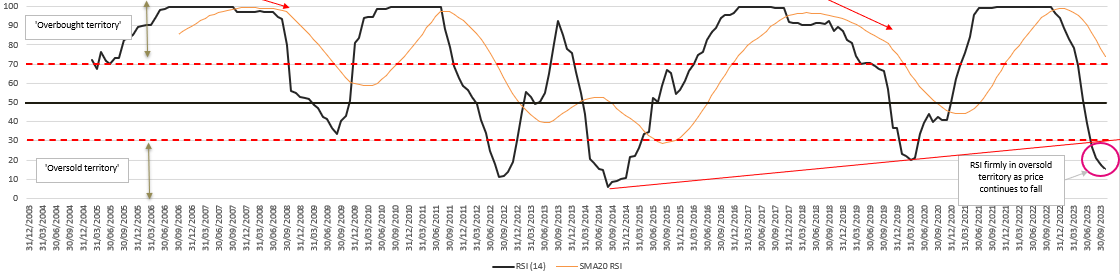
The Relative Strength Index (RSI), which measures the speed and magnitude of a price movement, has fallen further, consolidating the bearish momentum. RSI levels below the ‘30 line’, are considered as a buy signal; only a break of the ’30 line’ up would signal a possible change in the index’s direction. However, the long-term indicator SMA50 is still rising, which implies that the index has not yet bucked its long-term rising trend.
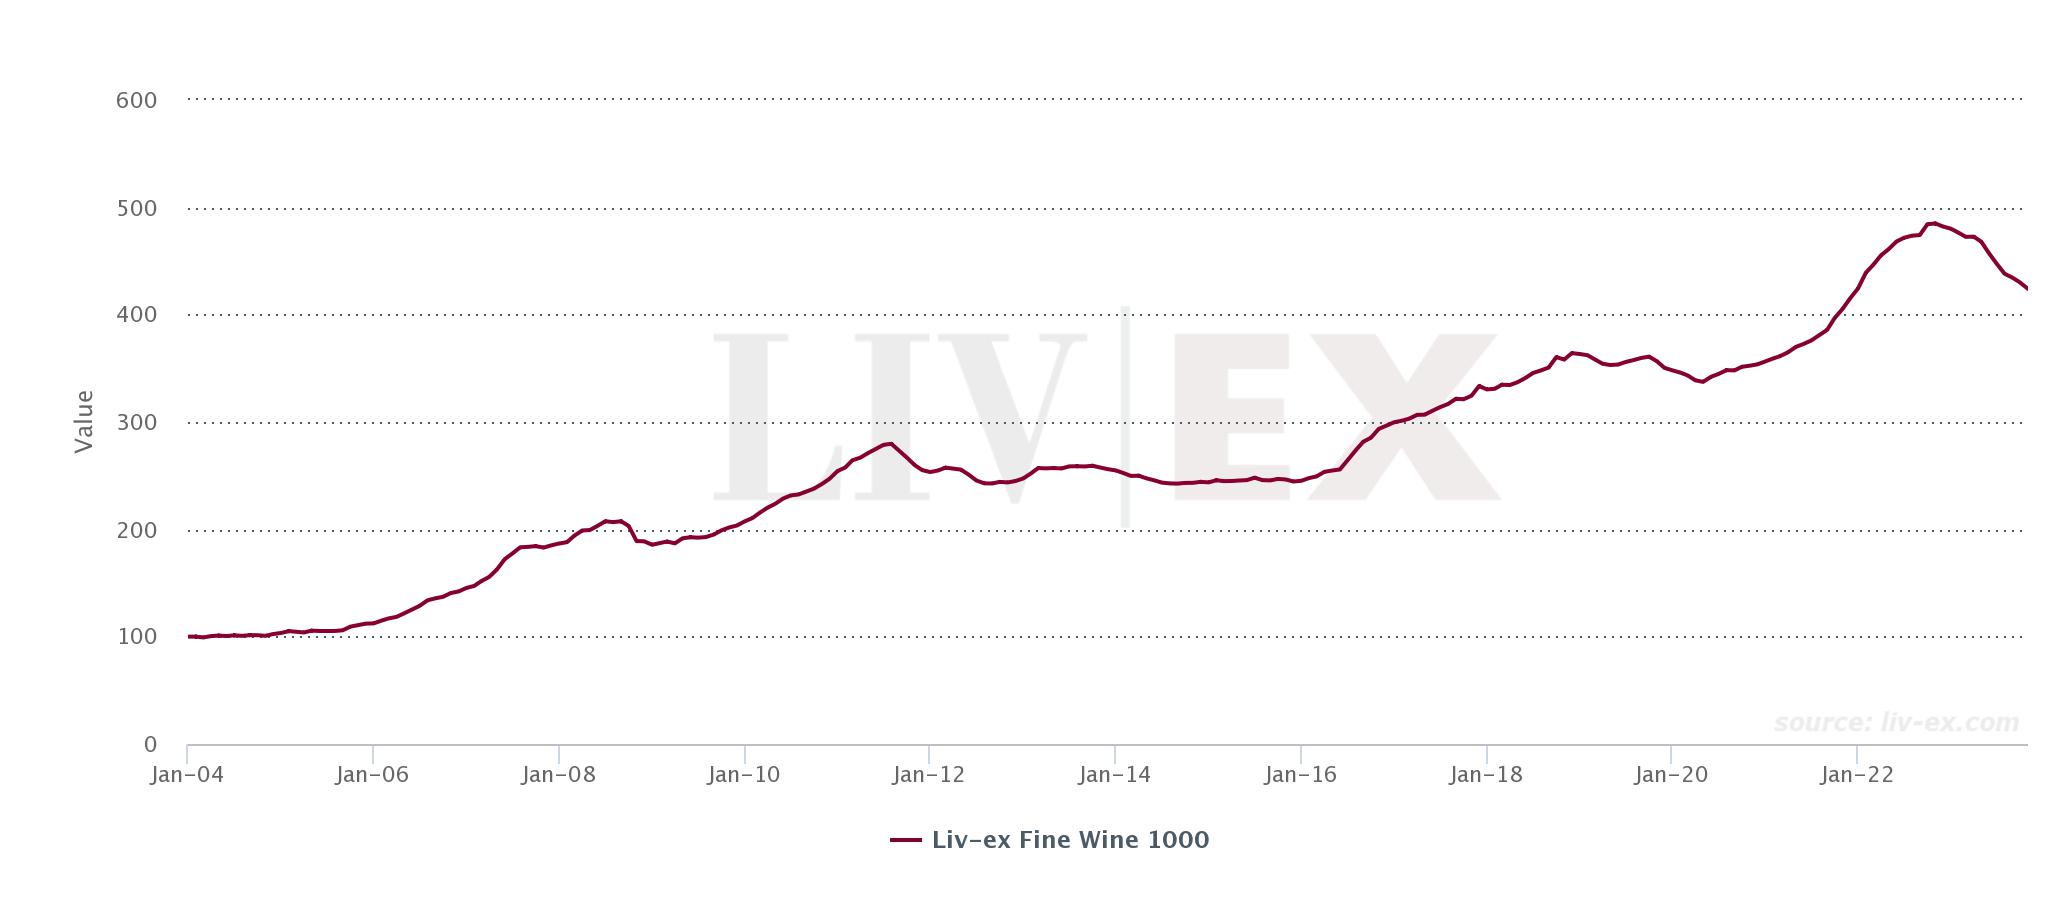
What is the Liv-ex 1000 index?
The Liv-ex Fine Wine 1000 Index is broadest measure of the market. It represents the price movement of 1,000 of the most sought-after fine wines on the world’s most active and liquid marketplace. Stretching back over 20 years, the Liv-ex 1000 is comprised of seven sub-indices from across the world: the Bordeaux 500, the Bordeaux Legends 40, the Burgundy 150, the Champagne 50, the Rhone 100, the Italy 100 and the Rest of the World 60.
All Liv-ex indices are calculated using our Mid Price: the mid-point between the highest live bid and lowest live offer on the market. These are the firm commitments to buy and sell at that price; transactional data rather than list prices. It represents the actual trading activity of 620+ of the world’s leading fine wine merchants. Because Liv-ex doesn’t itself trade, this data is truly independent and reliable.