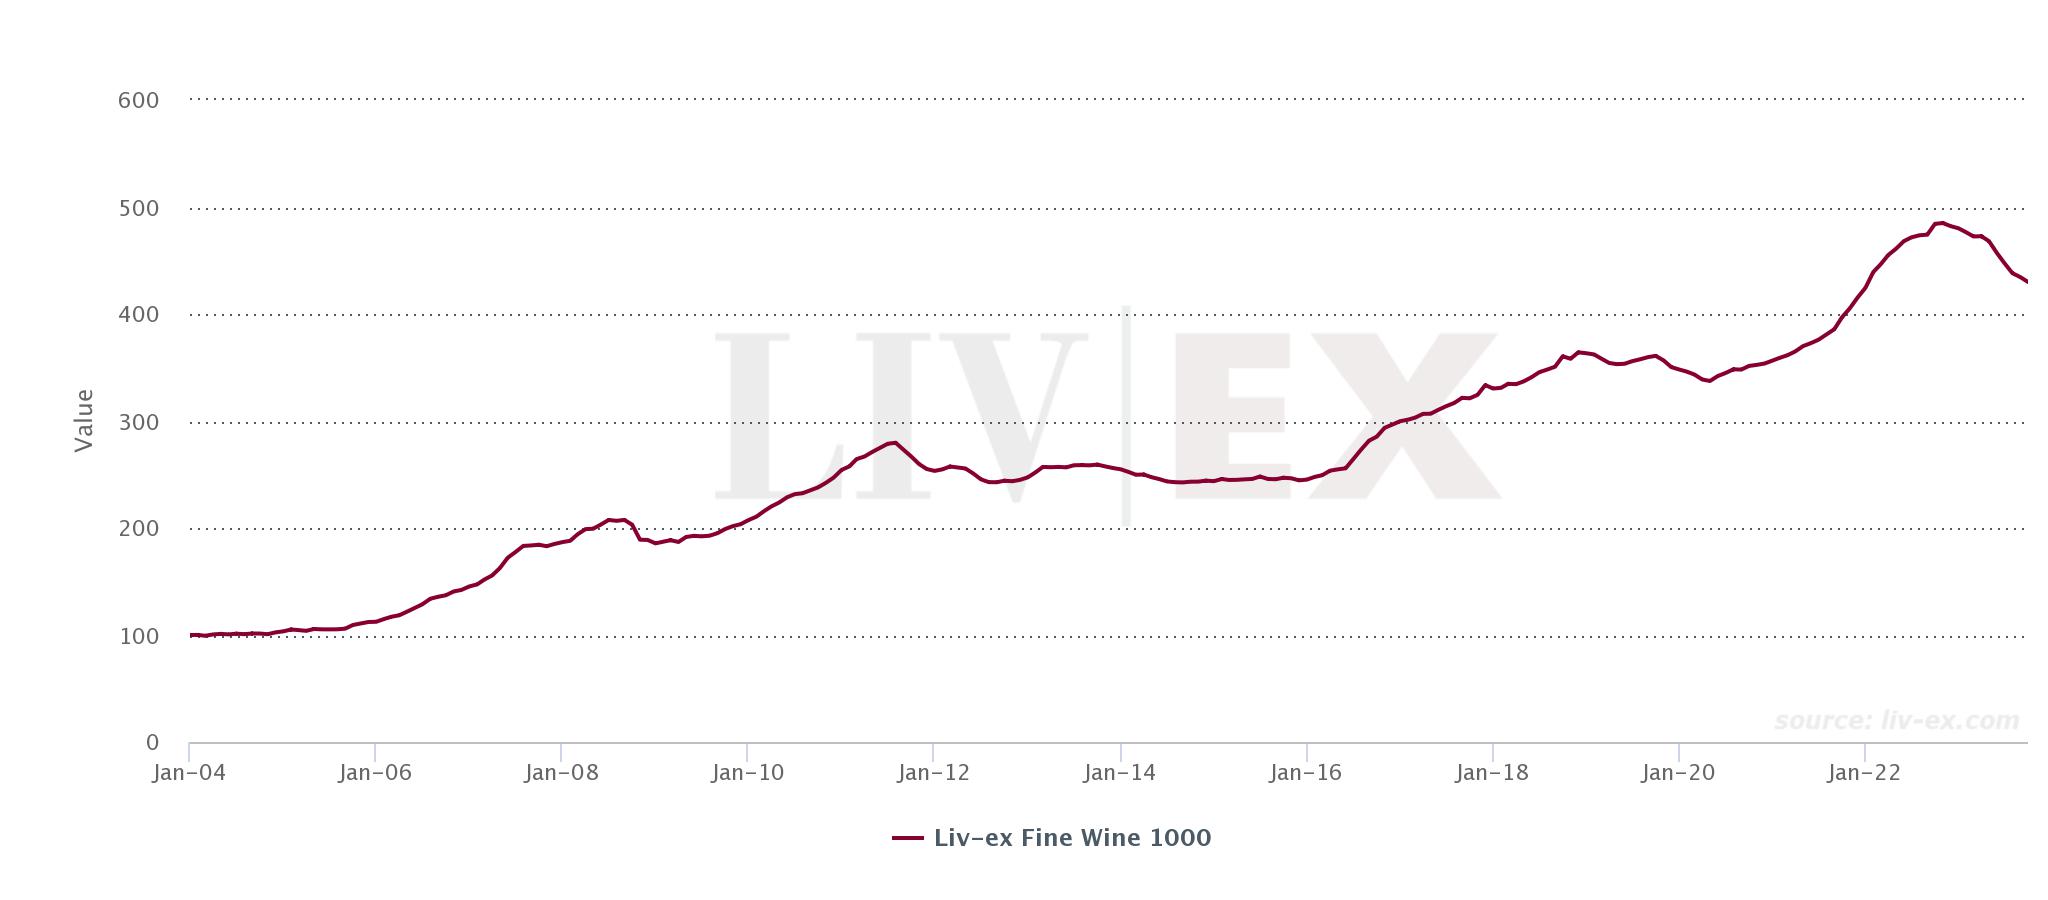
- The Liv-ex 1000 fell by 1.0% in September, an increased rate than August but still slower than the declines experienced in June and July.
- Year-to-date, all of its sub-indices are down.
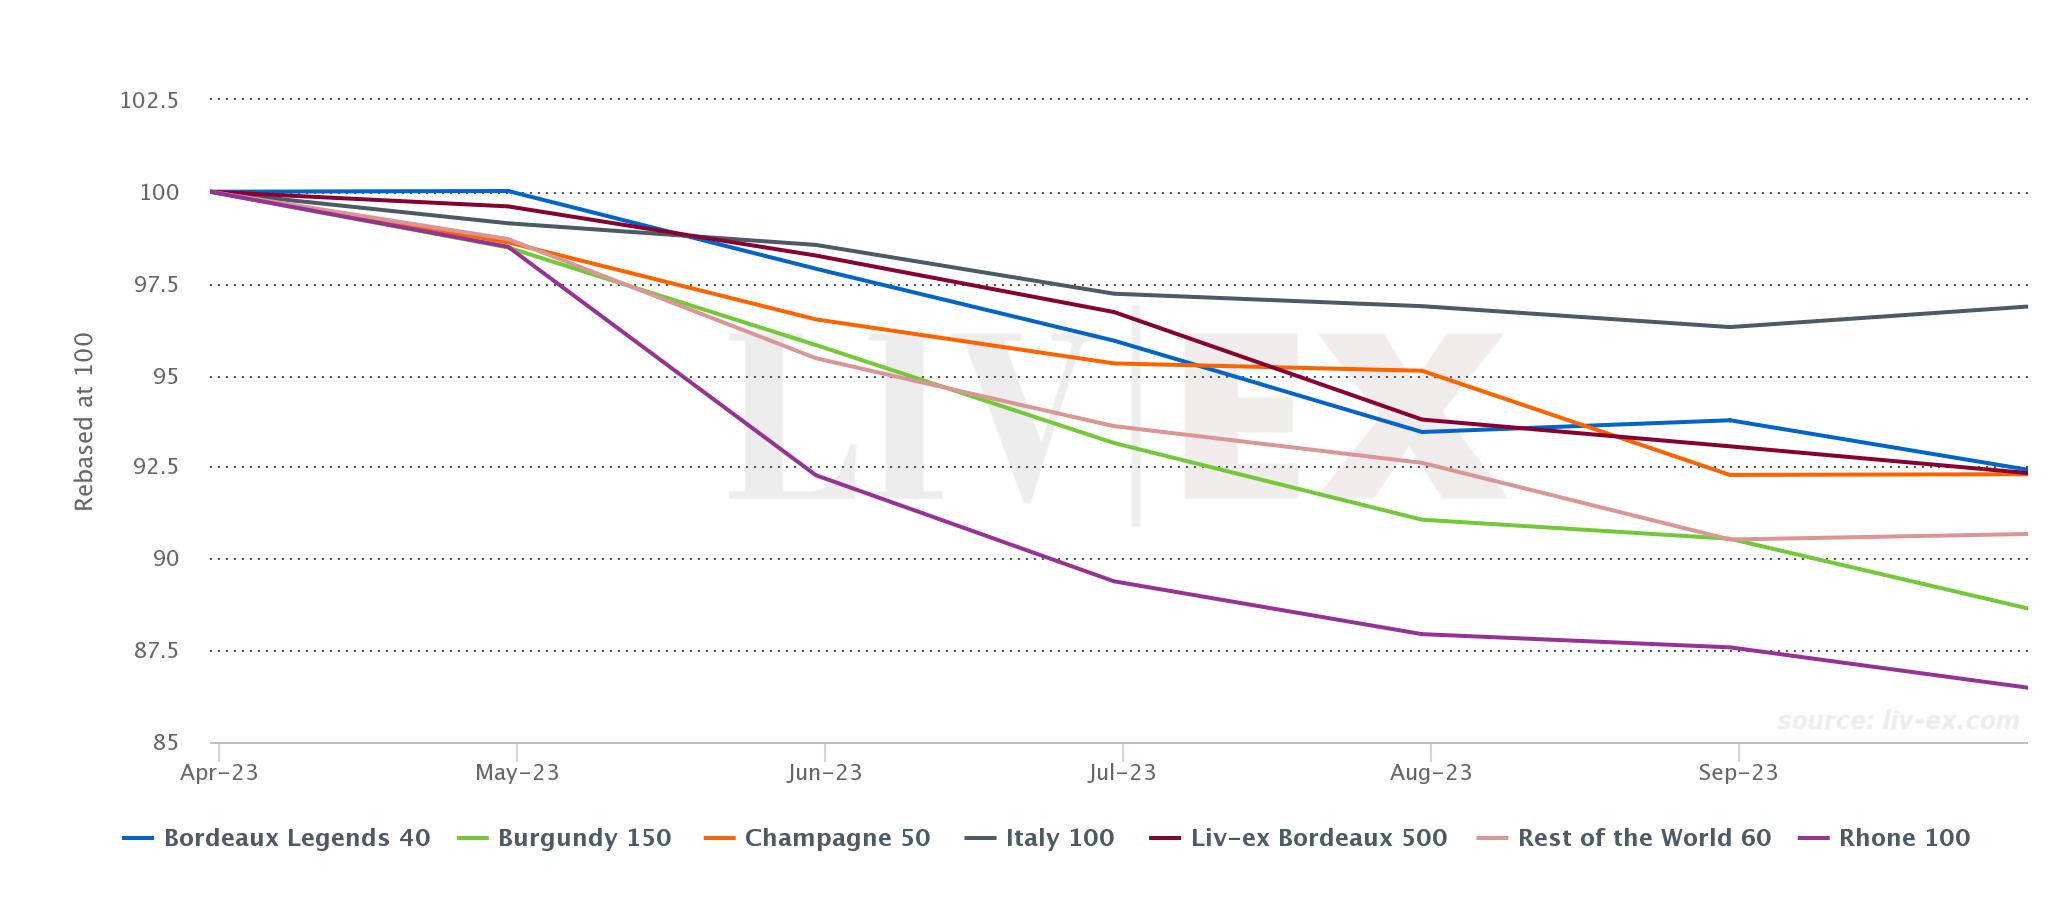
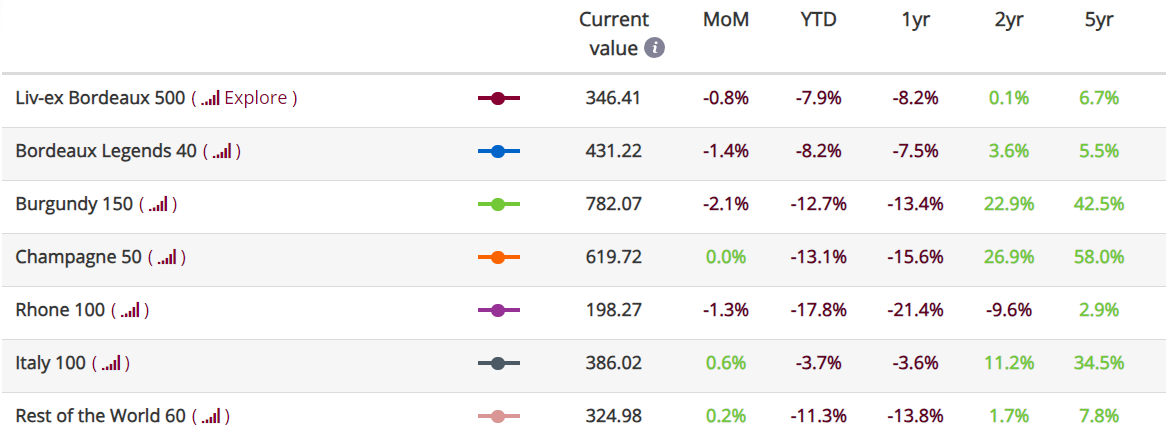
- It’s not all negative, though: in September, the Italy 100 and Rest of the World 60 increased month-on-month, while the Champagne 50 ran flat.
*made using the Liv-ex Charting Tool.
In August, the Liv-ex Fine Wine 1000, the broadest measure of the secondary market, continued its decline. It fell by 1.0%, more than the previous month’s 0.8% but lower than the 2.1% drops observed in both June and July. Year-to-date, the index has fallen by 10.4%.
Both the Liv-ex Fine Wine 100 (the industry benchmark) and the Liv-ex Fine Wine 50 (which tracks the movement of First Growths) continued to fall in September. However, they followed the previous month’s trend of slowing declines, both falling by 0.1% in September compared to their respective 1.3% and 1.5% drops in August.
Off the back of the downturn this summer which increasingly pointed towards a buyers’ market, September saw increased trading activity, with trade by both value and volume showing an uptick. Market breadth also expanded, with 2,202 individual labels (LWIN 11s) trading on Liv-ex last month.
The Italy 100 rises by 0.6% in September
*made using the Liv-ex Charting Tool.
August marked the first positive movement after three consecutive months of negative or stagnant performance across all Liv-ex Fine Wine 1000 sub-indices. The Bordeaux Legends 40 rose by 0.3%, and the Sauternes
In September, while the Fine Wine 1000 declined at a faster pace than the previous month, several of its sub-indices showed signs of positivity. The Italy 100 increased by 0.6%, the Rest of the World 60 by 0.2% and the Champagne 50, after its steep decline of 3.0% last month, showed stability and ran flat. The Bordeaux 500, on the other hand, experienced a 0.8% decline, same as the movement it recorded last month.
The top-performing wine in the Liv-ex 1000 this month was Fontodi, Flaccianello delle Pieve, Colli della Toscana Centrale 2017, with a 21.0% increase in its Mid Price*. Other strong performers included Sassicaia, Tenuta San Guido, Bolgheri 2014 (+9.3%) and Solaia, Toscana 2018 (+6.4%). In all, Tuscany had 40 wines experience a positive or flat movement in September, with only eight wines declining.
Likewise, Piedmont also demonstrated a strong performance in September, with 35 wines experiencing positive or stable movements, and only five wines showing downward trends. Notably, Bruno Giacosa’s Barolo, Falletto Vigna Le Rocche Riserva 2016 ranked among the top five performers of the Liv-ex Fine Wine 1000, achieving an increase of 13.7% in its Mid Price.
In an interesting turn of events, the Bordeaux Legends 40, after its positive result in August, was down 1.4% in September. Even steeper declines were recorded by the Burgundy 150 index (-2.1%) and the Rhône 100 index (-1.3%).
Technical Analysis – The index is toeing the line
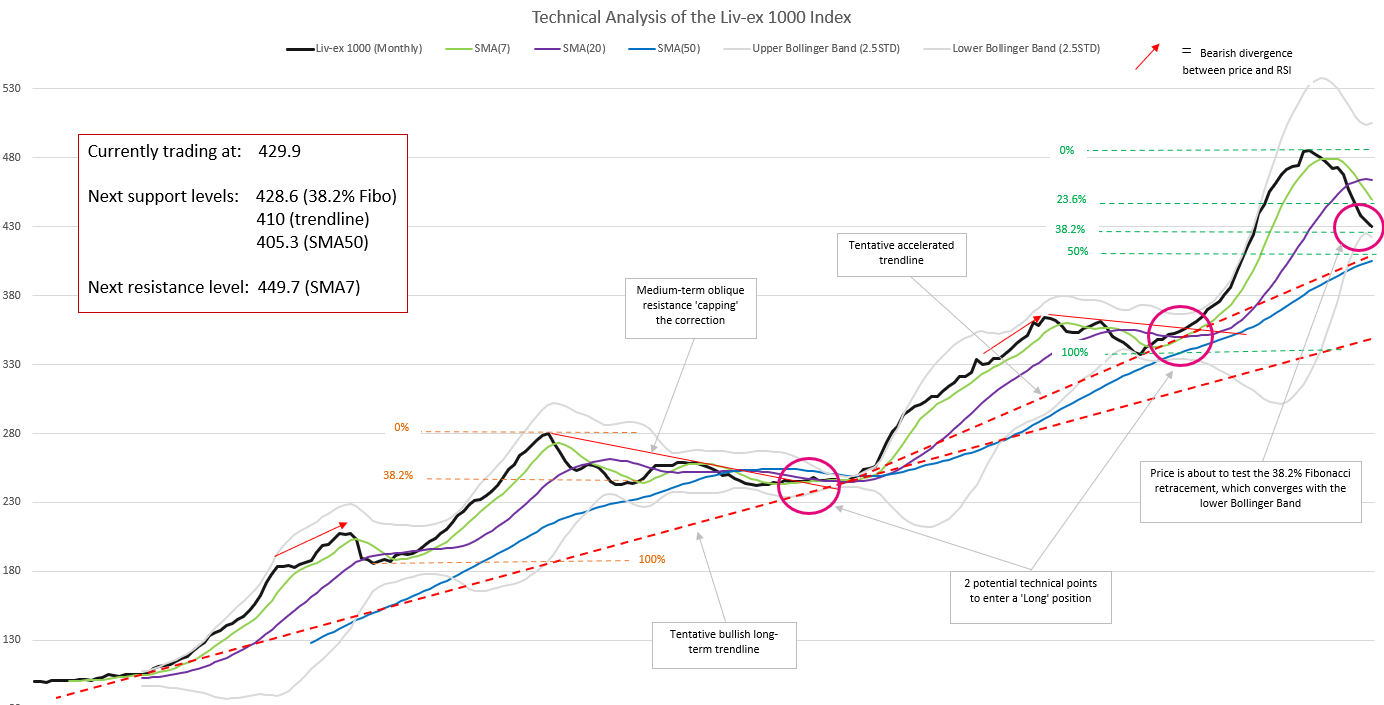
After its 1.0% fall in September, the index price now stands halfway between the Simple Moving Average 7 months (SMA7, in green on the chart below) and the SMA50 (in blue), which is still rising and a gauge of the medium-term bullish trend. Simple Moving Averages (SMAs) which are calculated by averaging a selected range of prices of a period of time, are used as indicators of whether a price is likely to continue on or change its trajectory. If a long-term average like the SMA50 is still rising, it implies that the index has not yet bucked its rising trend.
The Liv-ex Fine Wine 1000’s price is also within a whisker of the 38.2% Fibonacci retracement we discussed in our previous reports. This Fibonacci retracement level, which indicates how far an index’s price has retraced its prior movement (in this case, its prior gain), is about to be ‘tested’, meaning it could either provide support or resistance for the index in coming months.
Liv-ex is considering expanding its technical analysis offering. As such, we are interested to hear how useful such tools are to you. Click on this link to complete a short survey.
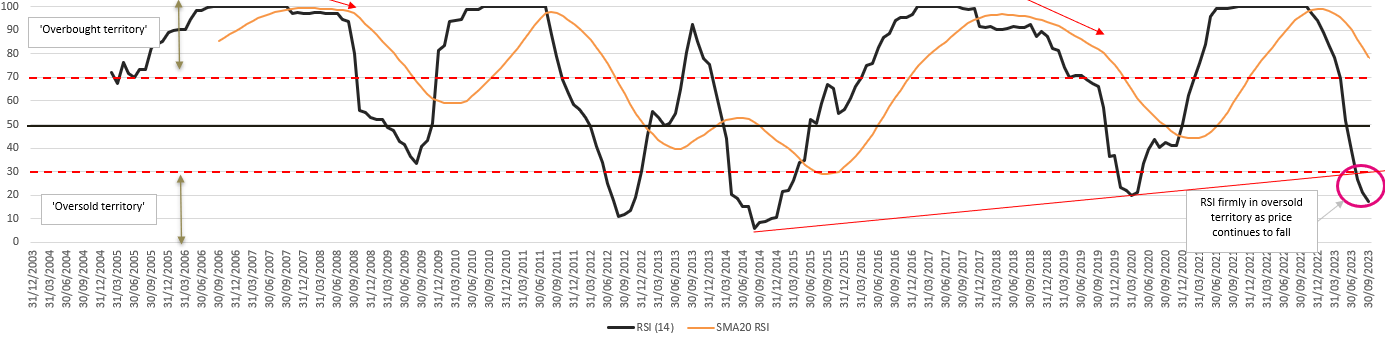
In tandem with the index price, the Relative Strength Index (RSI), which is used to measure the speed and magnitude of a price movement, extended its move down (the ‘acceleration’ we discussed in our August report). While the RSI is now firmly in oversold territory, as we mentioned last month, only a break of the ’30 line’ and of the ascending trendline on the indicator (which is coincidentally converging with the ’30 line’) would signal a possible change in the momentum’s direction.
Volatility on the rise?
The Bollinger Bands (BBs) are beginning to open up, however, possibly heralding an increase in the index’s volatility. Proponents of technical analysis believe that the closer the prices are to the upper BB, the more overbought the market is, and vice versa. It is also widely thought that a ‘squeeze’ in the Bollinger Bands signals a period of low volatility, whereas the bands moving apart indicate the index is moving towards a trending movement (upwards or downwards) instead of bouncing between the two bands. The price action of the next few months will show whether the lower BB will provide support for the price, or whether the price will follow the lower BB further down.
Besides the BBs opening up, not much has changed since last month: the index is in a corrective phase (as evidenced by an 11th month of consecutive declines) but remains in a bullish long-term trend.
Where are the index’s next support levels?
The lower BB and the 38.2% Fibonacci levels are the immediate levels of potential support for the index. However, the SMA50, the 50% Fibonacci retracement level, and, more importantly, the tentative long-term accelerated trendline – all converging around the 405-410 level – form the main support zone we will closely monitor.
What is technical analysis?
Technical analysis is a method of forecasting future movements by looking back, the theory being that historical trading activity can be a valuable indicator of its future price movements.
What is the Liv-ex 1000 index?
The Liv-ex Fine Wine 1000 Index is broadest measure of the market. It represents the price movement of 1,000 of the most sought-after fine wines on the world’s most active and liquid marketplace. Stretching back over 20 years, the Liv-ex 1000 is comprised of seven sub-indices from across the world: the Bordeaux 500, the Bordeaux Legends 40, the Burgundy 150, the Champagne 50, the Rhone 100, the Italy 100 and the Rest of the World 60.
*All Liv-ex indices are calculated using our Mid Price: the mid-point between the highest live bid and lowest live offer on the market. These are the firm commitments to buy and sell at that price; transactional data rather than list prices. It represents the actual trading activity of 620+ of the world’s leading fine wine merchants. Because Liv-ex doesn’t itself trade, this data is truly independent and reliable.