- The Liv-ex 1000 index fell by 0.8% in August, marking a slower rate of decline compared to July.
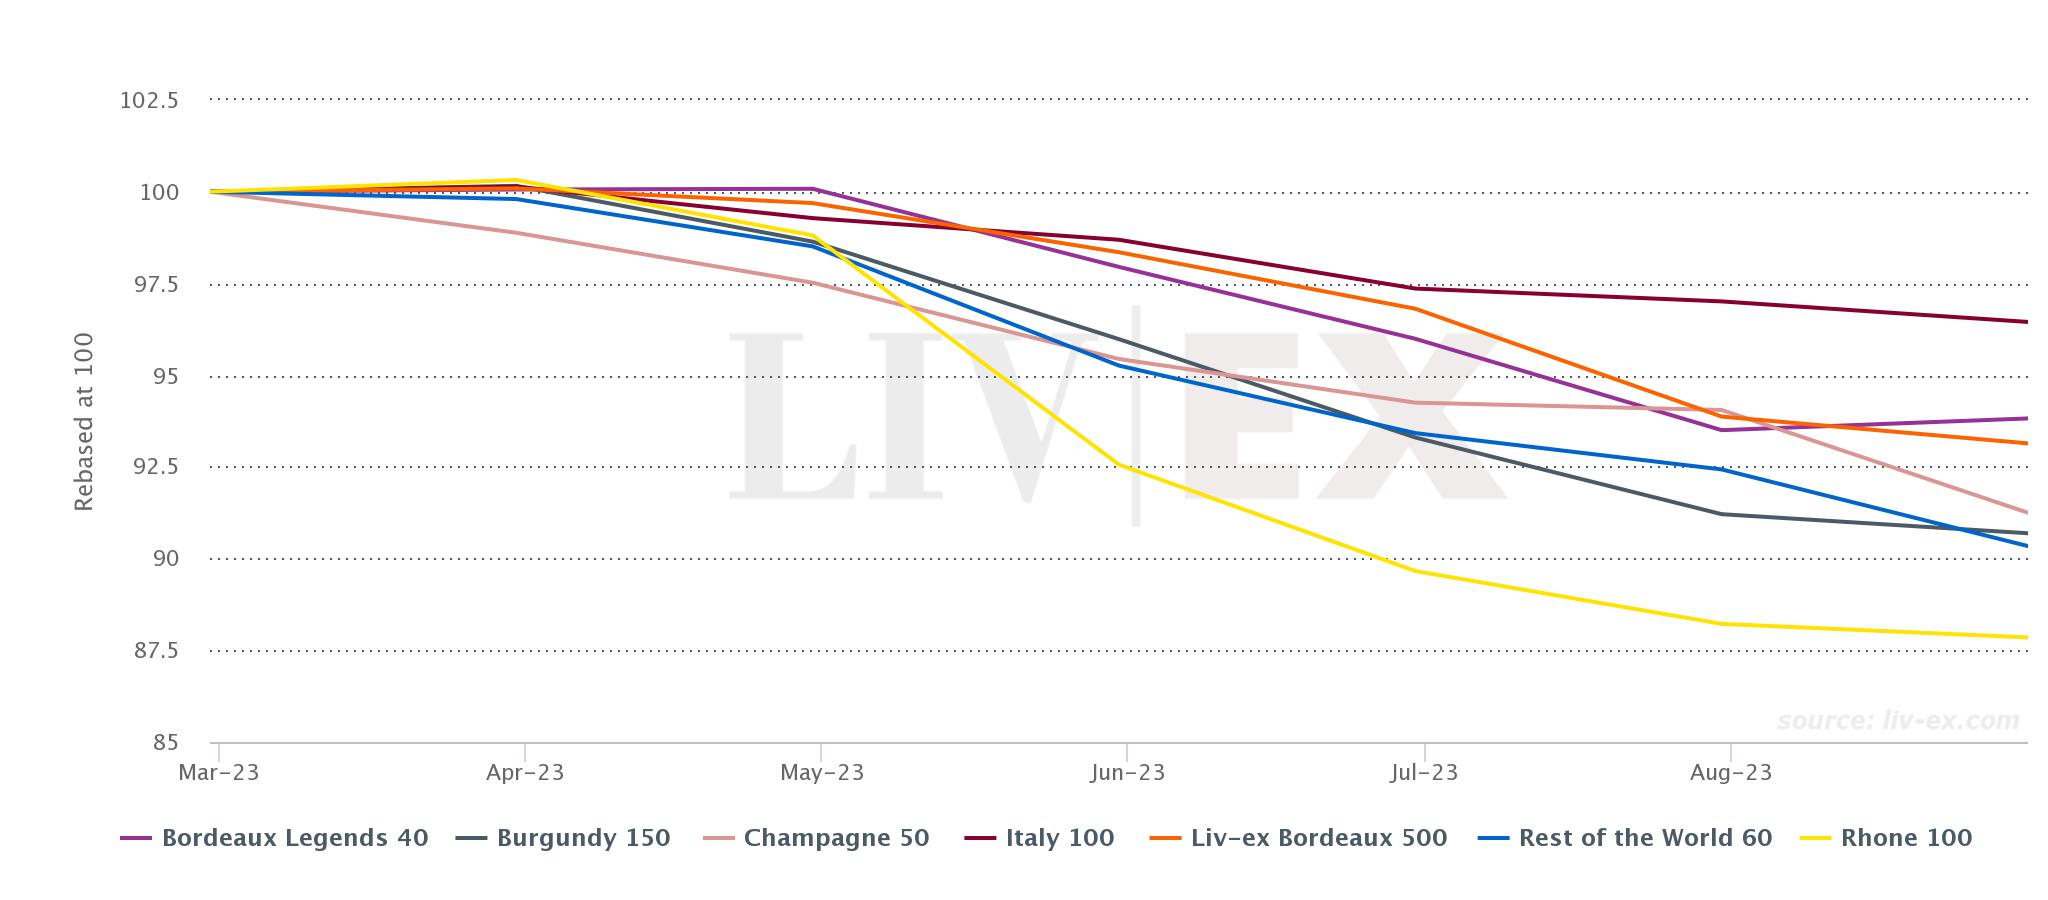
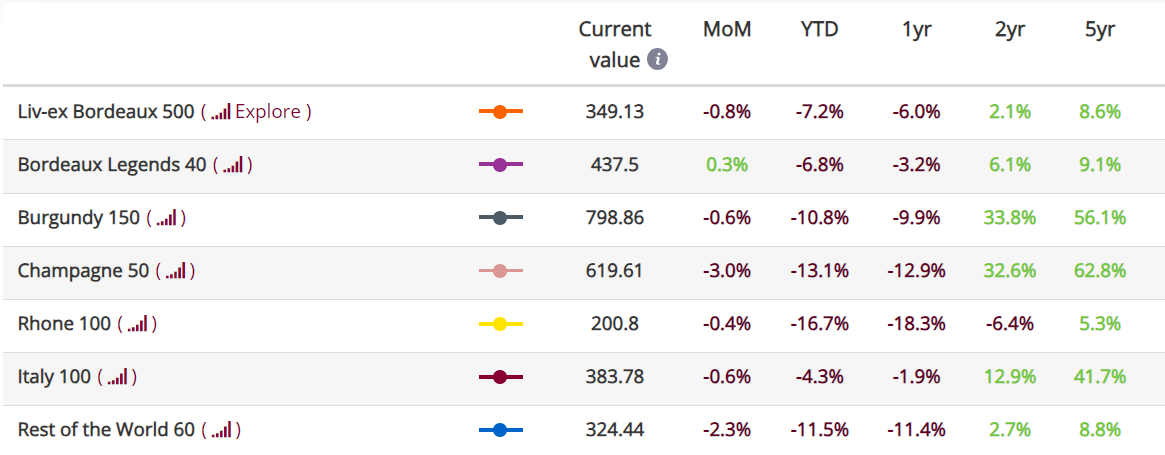
- Year-to-date, all of its sub-indices have recorded declines.
- The Bordeaux Legends 40 sub-index stood out with a 0.3% increase in August.
*made using the Liv-ex Charting Tool.
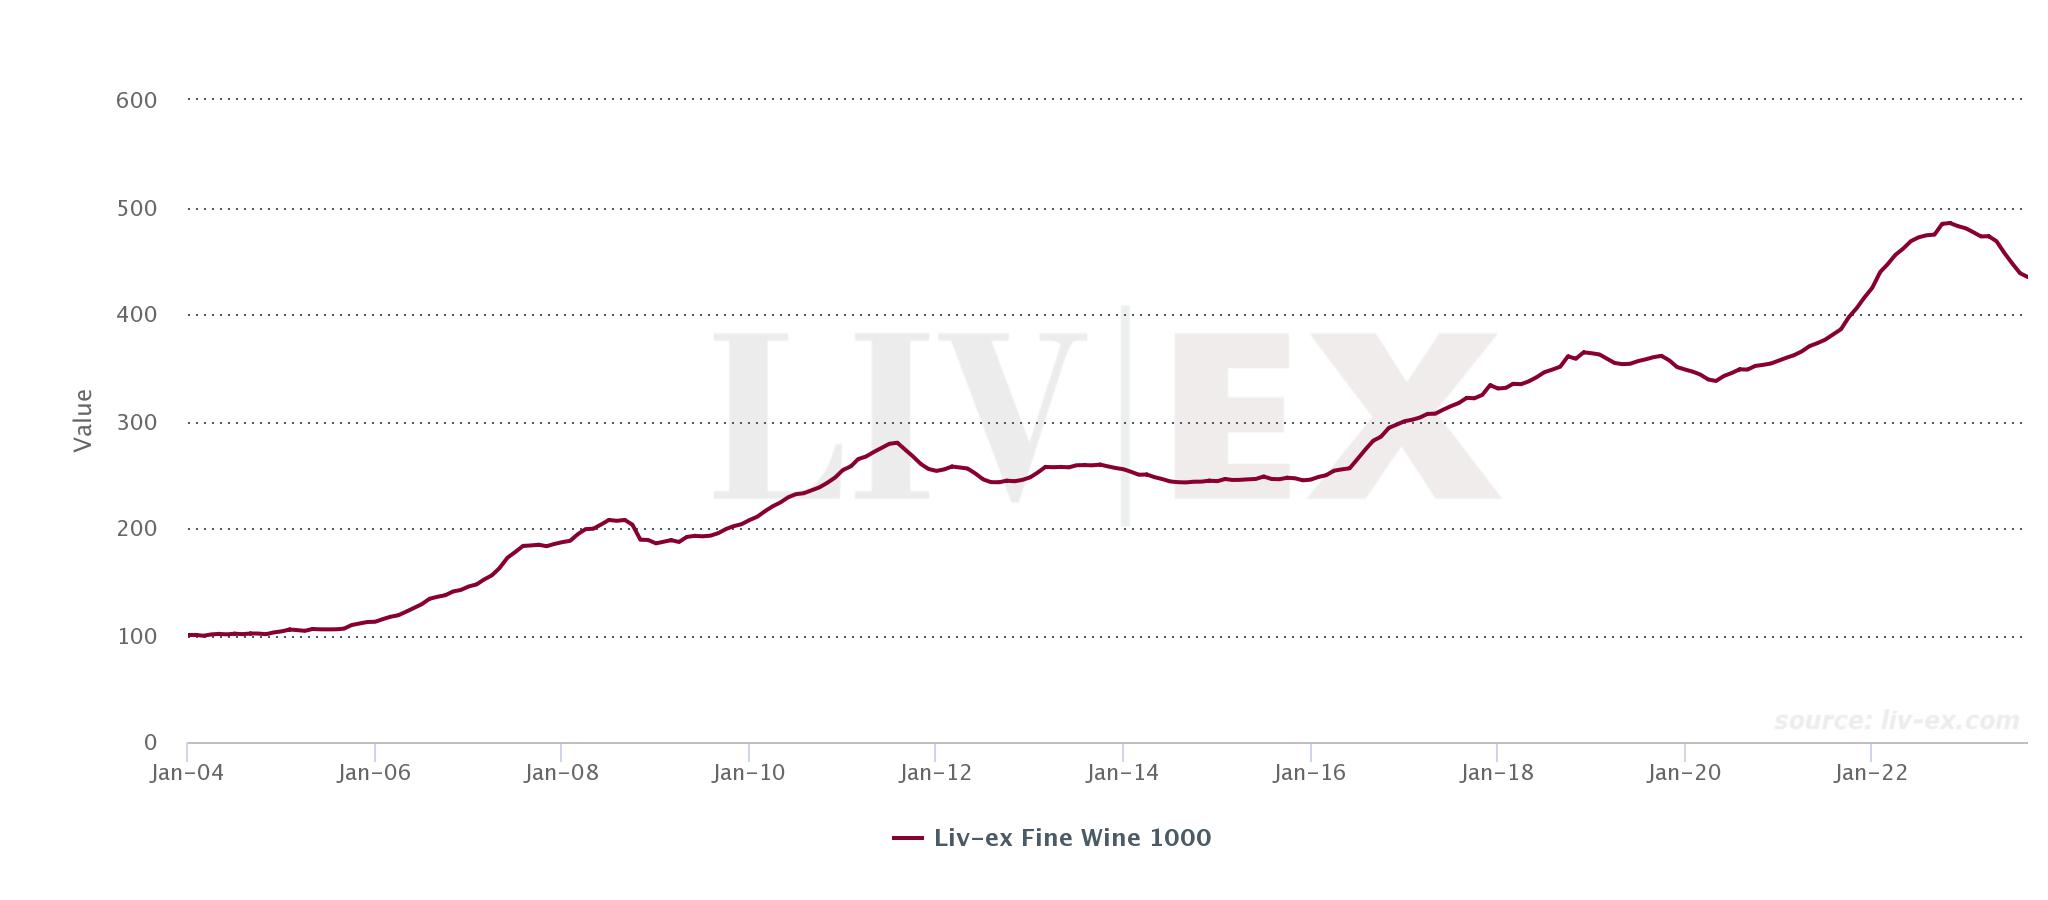
In August, Liv-ex Fine Wine 1000 index, the broadest measure of the secondary market, continued its decline at a slower pace of 0.8%, in contrast to the 2.1% drops observed in both July and June. This stabilisation could be attributed to sellers adjusting their prices and increased buyer participation. Nevertheless, the year-to-date performance of the index still reveals a 9.5% decrease.
Both the Liv-ex Fine Wine 100 (the industry benchmark) and the Liv-ex Fine Wine 50 (which tracks the movement of First Growths) also fell in August. However, they followed the broader trend of slowing declines, with decreases of 1.3% and 1.5%, respectively, compared to the previous month’s 3.1% and 3.7% drops.
Off the back of the downturn in July, August experienced increased trading activity, with trade by both value and volume showing an uptick. Market breadth also expanded, with 2,035 individual labels (LWIN 11s) trading on Liv-ex over the past month.
Bordeaux Legends 40 grows 0.3% in August
*made using the Liv-ex Charting Tool.
The Bordeaux Legends 40 index, which tracks the price performance of 40 Bordeaux wines from exceptional older vintages, rose by 0.3% in August, a contrast to the three consecutive months of negative or flat movements in all the LX1000’s sub-indices.
Among the top performers in the index, Le Pin 1998 saw its price increase the most in August, climbing by 11.0%. It was followed by Château Haut-Brion 1990, which saw an 8.7% rise, and Château Margaux 1990, with a 7.3% increase. The renewed interest in these established labels and well-regarded vintages suggests that buyers are seeking security amid the current uncertainty in the market.
The Champagne 50 has gone from the best-performing sub-index of the Liv-ex Fine Wine 1000 last month, falling by just 0.2%, to the worst performer in August, with a substantial decline of 3.0%. This shift is somewhat unexpected, given the increased activity surrounding Champagne this month.
Year-to-date, August recorded the second-highest number of individual Champagne labels (LWIN 11s) trading and the highest level of trade by value and volume for wines from the region. This suggests that despite the clear interest and demand for Champagne, the ongoing price correction is a stronger driving force for the index.
Technical Analysis of the Liv-ex Fine Wine 1000
What is technical analysis?
Technical analysis is a method of forecasting future movements by looking back, the theory being that historical trading activity can be a valuable indicator of its future price movements.
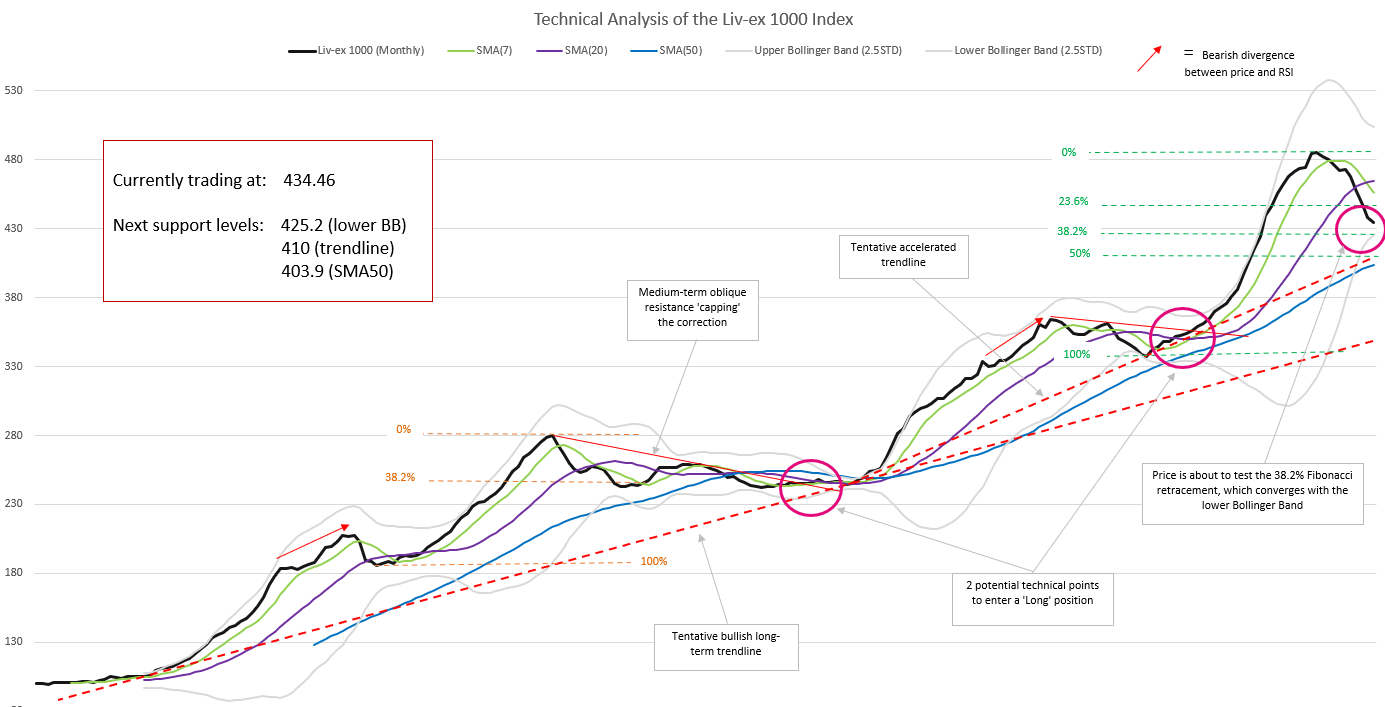
In August, the index continued to decline and is now about to test the 38.2% Fibonacci retracement level we discussed in last month’s analysis. These levels, based on the Fibonacci sequence, are lines that indicate where support and resistance for the index are likely to happen. The percentage of each level corresponds to how much the price of the index has retraced so far.
The lower Bollinger Band (BB) (which if touched can indicate the index is in oversold territory) has moved up slightly and is now converging with the 38.2% Fibonacci level. If this movement carries on, it could indicate some support provide some (temporary?) respite from the ongoing correction.
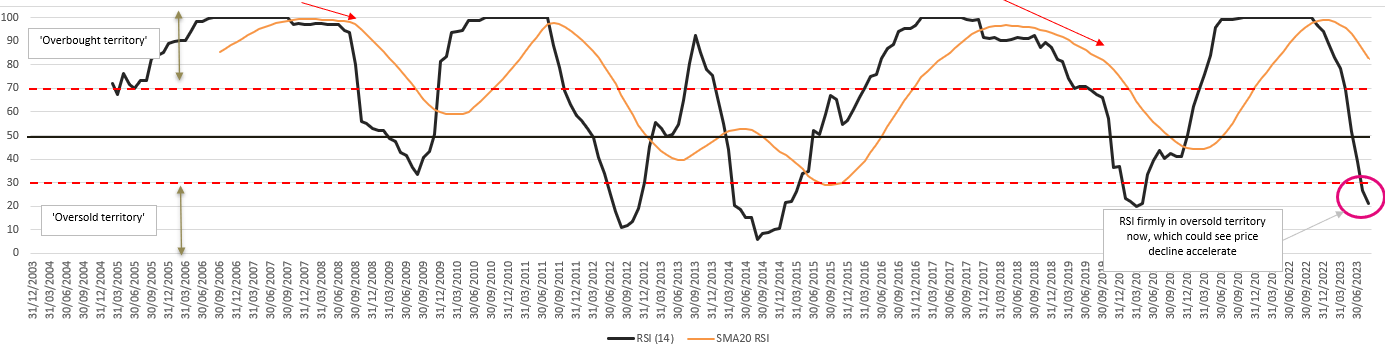
Further to the break of the ’30 line’ in July, the Relative Strength Index (RSI), which is used to measure the speed and magnitude of a price movement, moved sharply down in August. With price potentially reaching intermediary support levels mentioned above (the lower Bollinger Band, 38.2% Fibonacci retracement level), the RSI may stabilise in the next few months, indicating a slowdown in the index’s decline. However, only a break of the ’30 line’ up would signal a possible change in the index’s direction.
To conclude, not much has changed since July. Price needs time and space to correct after the 45% increase from April 2020 to October 2022. Even with a 10th month of consecutive declines, the LX1000 remains in a bullish long-term trend (the orange line on the first chart).
The lower BB and the 38.2% Fibonacci levels represent the first intermediary support level for the Liv-ex 1000 index, while the SMA50, the 50% Fibonacci retracement level, and the tentative long-term accelerated trendline – all converging as shown by the pink circle in Chart 1 – form the main support zone which we will pay closer attention to in the coming months.
What is the Liv-ex 1000 index?
The Liv-ex Fine Wine 1000 Index is broadest measure of the market. It represents the price movement of 1,000 of the most sought-after fine wines on the world’s most active and liquid marketplace. Stretching back over 20 years, the Liv-ex 1000 is comprised of seven sub-indices from across the world: the Bordeaux 500, the Bordeaux Legends 40, the Burgundy 150, the Champagne 50, the Rhone 100, the Italy 100 and the Rest of the World 60.
All Liv-ex indices are calculated using our Mid Price: the mid-point between the highest live bid and lowest live offer on the market. These are the firm commitments to buy and sell at that price; transactional data rather than list prices. It represents the actual trading activity of 620+ of the world’s leading fine wine merchants. Because Liv-ex doesn’t itself trade, this data is truly independent and reliable.