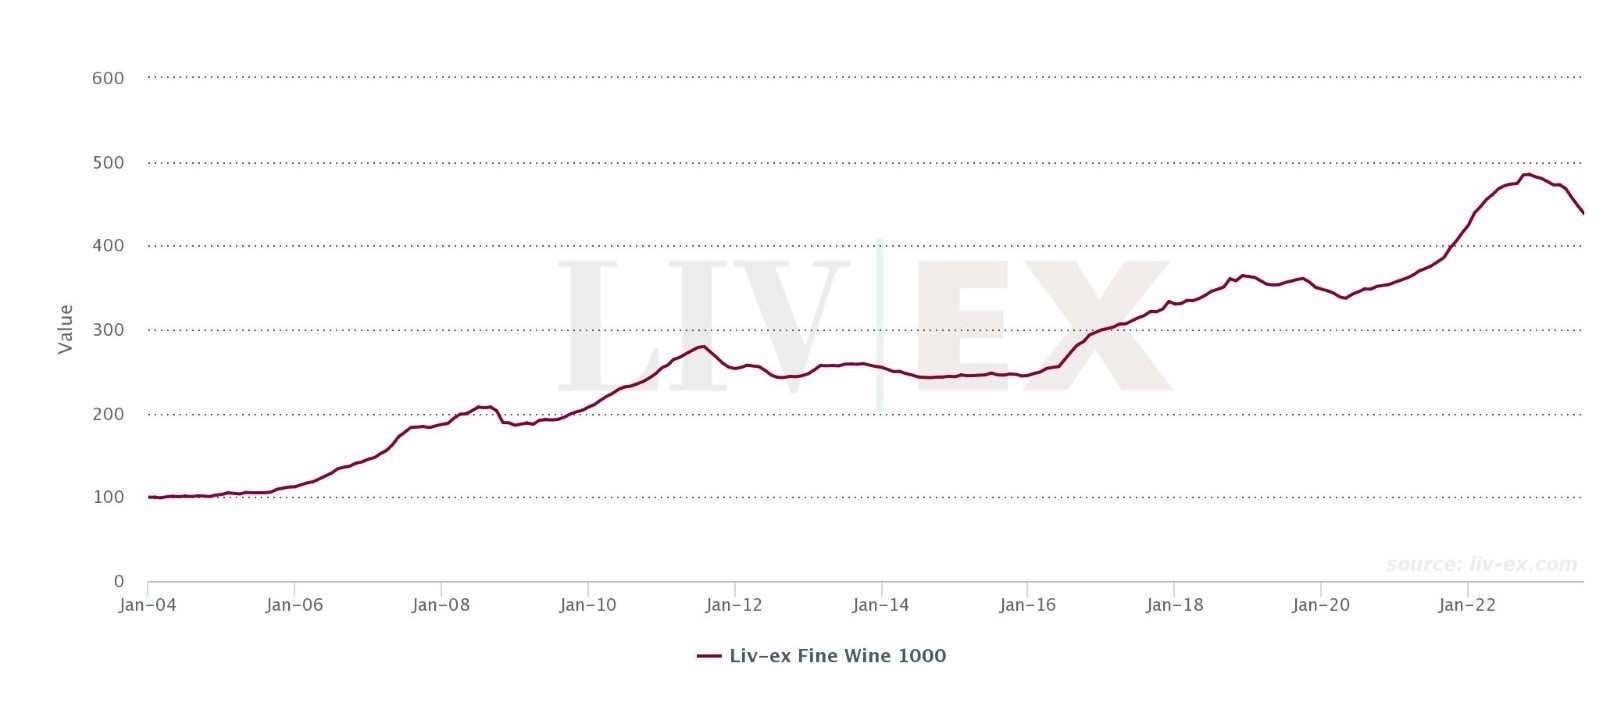
- The Liv-ex Fine Wine 1000 index fell 2.1% in July, mirroring the June retraction.
- Year-to-date, all of its sub-indices are down.
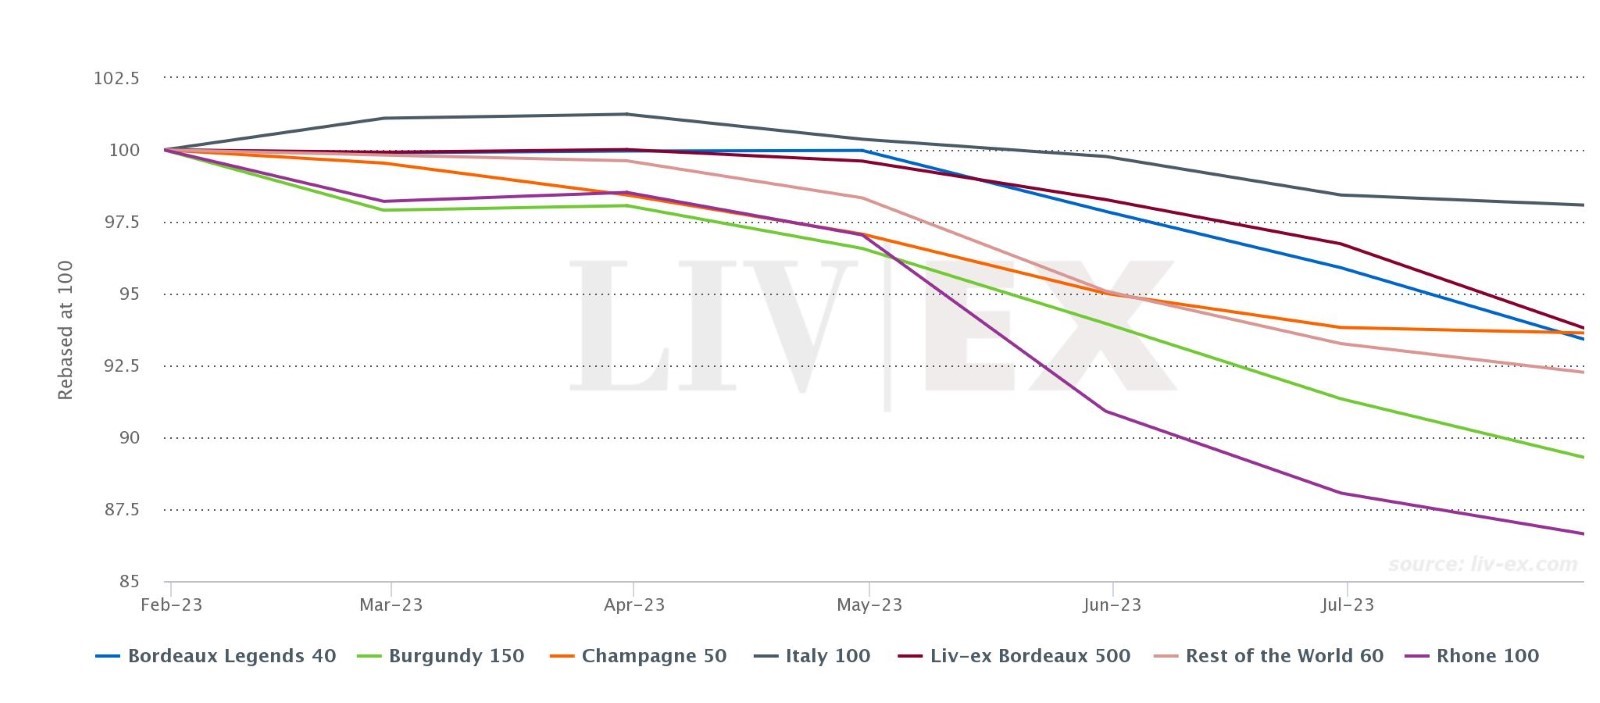
- The Bordeaux 500 was the worst performer in the index, down 3.0% in July.
*made using the Liv-ex Charting Tool.
The Liv-ex Fine Wine 1000 index, the broadest measure of the secondary market, sustained a further 2.1% decline in July, mirroring June’s 2.1% decline. The aftermath of an expensive En Primeur 2022 campaign, which generated mixed feelings, combined with heightened risk aversion in the market and the start of the holiday season led to a fall in the number and value of bids last month. Year-to-date, the index is down 8.7%.
Both the Liv-ex Fine Wine 100 (the industry benchmark) and the Liv-ex Fine Wine 50 (which tracks the movement of First Growths) also fell in June, recording monthly declines of 3.1% and 3.7% respectively.
Trading activity in July however rose by both value and volume as sellers reduced prices to clear. The market breadth also expanded month-on-month, with 1,865 individual labels (LWIN 11s) trading on Liv-ex over the course of the past month.
The Bordeaux 500 falls 3.0% in July
*made using the Liv-ex Charting Tool.
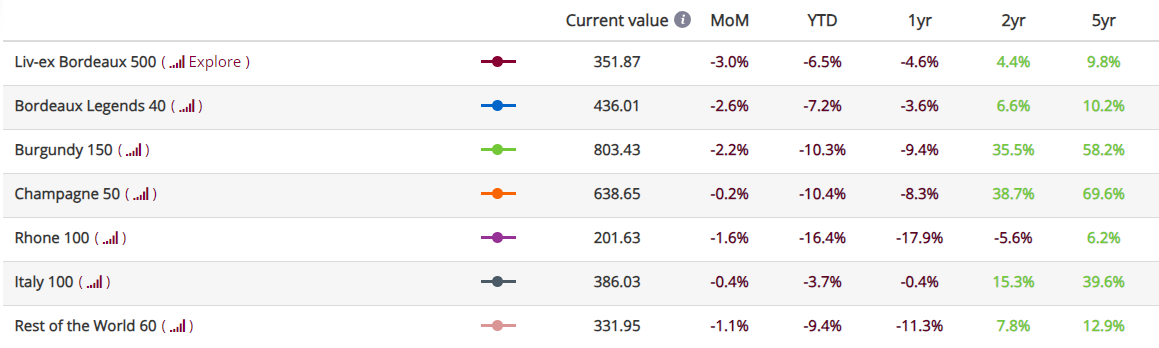
While the Rhône 100 experienced yet another decline in July to maintain its position as the worst-performing sub-index of the Liv-ex 1000 so far this year, the decrease was only 1.6% this month, in comparison with June’s 3.1% drop.
It was Bordeaux that created the greatest downward pressure on the LX1000, with the Bordeaux 500 declining by 3.0%. Notable falls included Château Haut-Bailly Cru Classé 2019 (-16.5%), Château Calon Ségur 3ème Cru Classé 2012 (-15.7%), and Château Clinet 2017 (-14.7%).
The Champagne 50 sub-index recorded the lowest decline this month, dropping by only 0.2%. Having pulled back by 10% YTD, there are some tentative signs of buyers returning to the region.
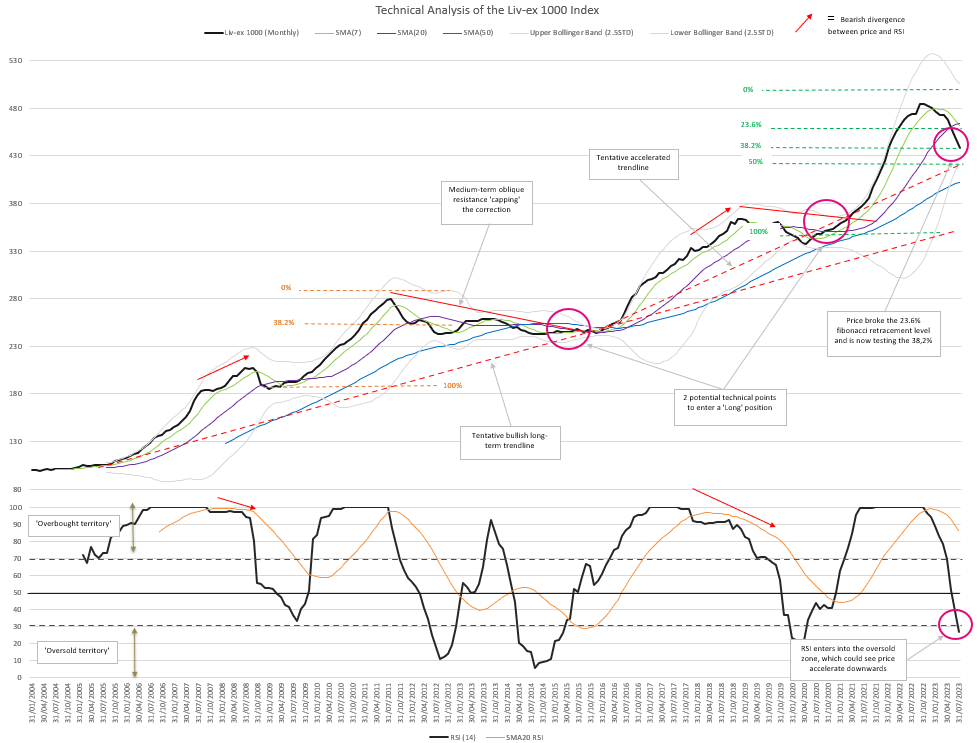
Technical Analysis of the Liv-ex 1000 Index
What is technical analysis?
Technical analysis is a method of forecasting future movements by looking back, the theory being that historical trading activity can be a valuable indicator of its future price movements.
Breaking through and finding support
In July, the Liv-ex 1000 index confirmed a significant breakthrough by surpassing the 23.6% Fibonacci retracement level. As it continues on its trajectory, it’s heading towards a new support area. This area is marked by two main elements: the 38.2% Fibonacci level at 428 and the lower Bollinger Band (BB) at 422, which is moving upwards.
A downward acceleration, with some elements of support
Last month, the Relative Strength Index (RSI) went above the ’70 line’. The implications of this breach suggest the potential for a downward acceleration in prices if these levels are sustained. Another development is the 7-month Simple Moving Average (SMA7) going below the SMA20, while the SMA20 is still going up. This theoretically lessens the worry about a strong drop in prices for now.
Interestingly, the index’s lower Bollinger Band (BB) is going up quickly. This is important because it could help stop the prices from falling too much; it might provide support around the 422 level.
Long-term trend
Referring back to last month’s analysis, even though the Liv-ex 1000 index’s price has been going down for nine months, the bullish long-term trend remains intact. Looking ahead, there’s the possibility of convergence between the SMA50, the 50% Fibonacci retracement level, and the tentative long-term accelerated trendline. These elements align around the 410 level, and the next few months could offer insight into how these converging factors might influence the index’s trajectory.
What is the Liv-ex 1000 index?
The Liv-ex Fine Wine 1000 Index is broadest measure of the market. It represents the price movement of 1,000 of the most sought-after fine wines on the world’s most active and liquid marketplace. Stretching back over 20 years, the Liv-ex 1000 is comprised of seven sub-indices from across the world: the Bordeaux 500, the Bordeaux Legends 40, the Burgundy 150, the Champagne 50, the Rhone 100, the Italy 100 and the Rest of the World 60.
All Liv-ex indices are calculated using our Mid Price: the mid-point between the highest live bid and lowest live offer on the market. These are the firm commitments to buy and sell at that price; transactional data rather than list prices. It represents the actual trading activity of 630+ of the world’s leading fine wine merchants. Because Liv-ex doesn’t itself trade, this data is truly independent and reliable.
To ensure the accurate representation of the wine market, Liv-ex indices undergo annual revisions. This process involves replacing older and less liquid wines with more actively traded ones. In the case of Bordeaux indices, this revision takes place every July. Specifically, for the Bordeaux 500 index this July, the 2020 vintage was added and the 2010 wines removed. This is with the exception of Forts de Latour, where the 2007 vintage has been replaced by the 2017 vintage. Latour also saw the removal of the 2005 vintage in favour of the 2015 vintage, while the 2009 vintage of Le Pin was replaced by the 2020 vintage. and There were no new vintages added for the five Sauternes wines.
Want more help navigating the current market? Book a meeting with your broker here: