- The Liv-ex Fine Wine 1000 index fell 2.1% in June, a smaller decline than last month.
- Year-to-date, all of its sub-indices are down.
- The Rhône 100 continues to be the worst performer in the index, down 3.1% in June.
*made using the Liv-ex Charting Tool.
The Liv-ex Fine Wine 1000 index, the broadest measure of the secondary market, showed a slower decline of 2.1% in June compared to the 2.4% decrease in it experienced in May, the largest drop in seven months. Year-to-date, the index has declined by 6.8%.
The Liv-ex Fine Wine 100 (the industry benchmark) and the Liv-ex Fine Wine 50 (which tracks the movement of First Growths) also fell in June, recording monthly decreases of 2.9% and 2.4% respectively. These negative movements reflect the market’s cautiousness in light of global economic uncertainty and a distracting En Primeur campaign that fell short of expectations.
Trade was down both by value and volume in June. The breadth of the market also declined slightly month-on-month, with 1,771 individual labels (LWIN 11s) traded on Liv-ex last month.
The Rhône 100 falls 3.1% in June
*made using the Liv-ex Charting Tool.
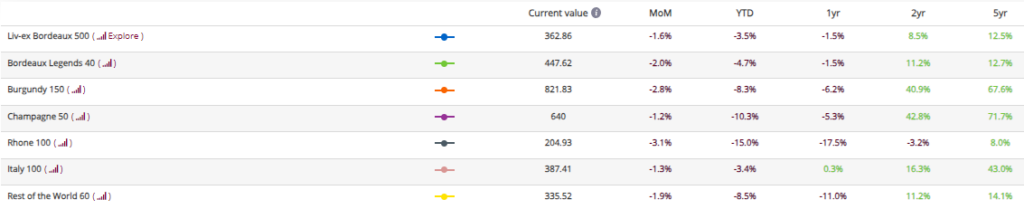
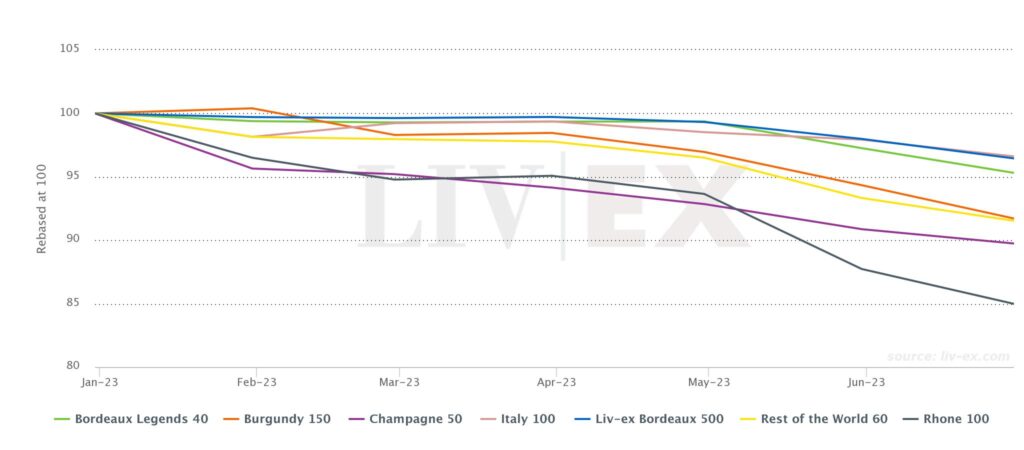
All of the Liv-ex 1000 sub-indices are down month-on-month and year-to-date.
In terms of resilience, the Italy 100 is performing better than the Bordeaux 500, with a year-to-date decrease of 3.4% compared to the Bordeaux 500’s 3.5%. The Bordeaux 500’s decline in June was greater than the previous month’s (1.6% and 1.3% respectively), which raises questions about the impact of a difficult En Primeur campaign on the Bordeaux market.
Interestingly, the Champagne 50 sub-index recorded the lowest decrease this month, dropping by just 1.2%. However, its year-to-date fall remains significant at 10.3%, placing it just behind the Rhône 100.
The Rhône 100 experienced a considerable month-on-month decline of 3.1%, which means it is down 15% year-to-date. The Rest of the World 60 recorded a smaller decline this month compared to the previous one, falling by only 1.9%.
Technical Analysis of the Liv-ex 1000 Index
What is technical analysis?
Technical analysis is a method of forecasting future movements by looking back, the theory being that historical trading activity can be a valuable indicator of its future price movements.
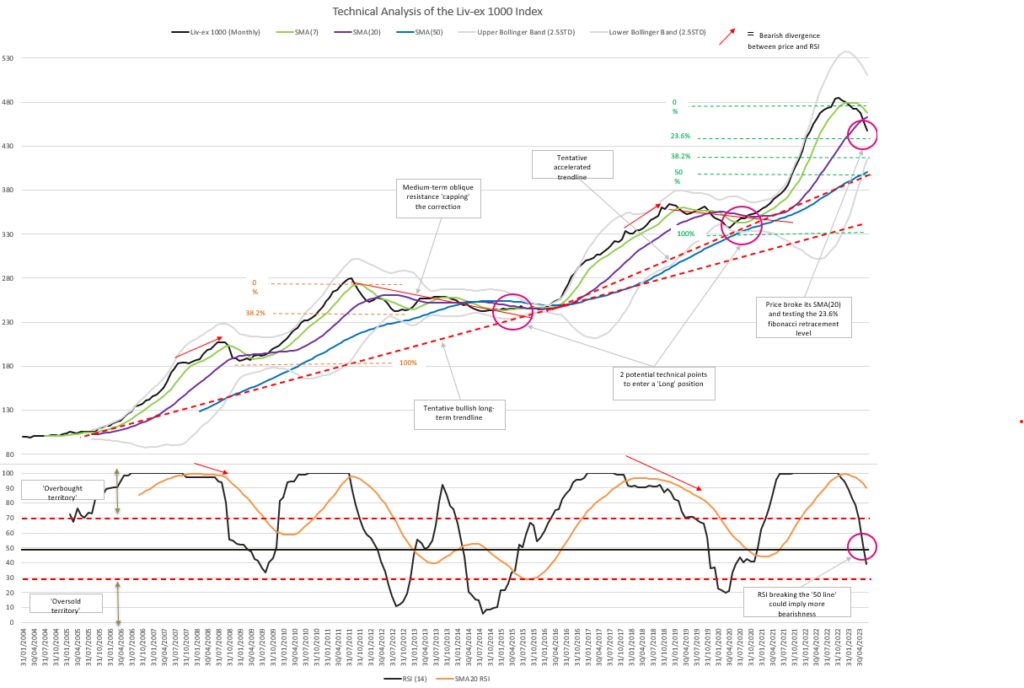
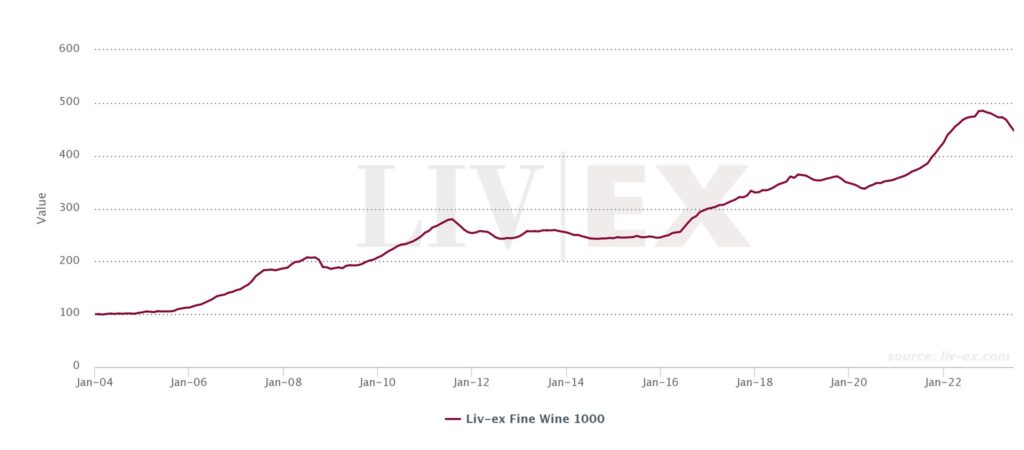
The bullish long-term trend of the index is intact.
The price of the Liv-ex 1000 index has been in a long-term bullish trendline since its inception. While there is currently no ‘confirmed’ ascending trendline supporting the price (three touch points), the tentative long-term and accelerated trendlines will be closely monitored should the price fall to the 310 and 410 levels respectively.
Over the last 20 years, the trend has seen four market tops (peaks), each of them resulting in only modest retracements (around 20% of the previous move up). Only in 2014 did price retrace to the 38.2% Fibonacci level. Retracements provide opportunities to ‘buy’ and get back into the long-term trend. We have highlighted two potential entry points on the charts.
Will the ongoing correction be different?
The last move up from 2020 was sharper and shorter than the previous three, as evidenced by the angle of the Simple Moving Averages (SMA), the price, and the widening of Bollinger Bands (BB). It is also noteworthy that the Relative Strength Index (RSI) has been in overbought territory (>70) for 3 years before recently falling and breaking the ‘50 line’ on 30th of June for the first time in almost 4 years. On that basis, it is possible that the ongoing price correction could be deeper than the previous 3.
Levels to watch and invalidations of the long-term bullish trend
The price has already broken its 7-month SMA and the 20-month SMA. We are now watching the 23.6%, the 38.2% and the 50% Fibonacci levels. The latter converges with the accelerated trendline, the 50-month SMA, and the rising lower BB. The SMA is the first main long-term support for the Liv-ex 1000 index. The long-term bullish trend will be invalidated if price breaks and confirms the tentative long-term trendline.
What is the Liv-ex 1000 index?
The Liv-ex Fine Wine 1000 Index is broadest measure of the market. It represents the price movement of 1,000 of the most sought-after fine wines on the world’s most active and liquid marketplace. Stretching back over 20 years, the Liv-ex 1000 is comprised of seven sub-indices from across the world: the Bordeaux 500, the Bordeaux Legends 40, the Burgundy 150, the Champagne 50, the Rhone 100, the Italy 100 and the Rest of the World 60.
All Liv-ex indices are calculated using our Mid Price: the mid-point between the highest live bid and lowest live offer on the market. These are the firm commitments to buy and sell at that price; transactional data rather than list prices. It represents the actual trading activity of 630+ of the world’s leading fine wine merchants. Because Liv-ex doesn’t itself trade, this data is truly independent and reliable.
Not a member of Liv-ex? Request a demo to see the exchange and a member of our team will be in touch with you shortly.