May Market Report
Share this article | Print this article
- All the major Liv-ex indices fell in April
- Technical Analysis of the Left Bank 200 index confirms a long-term bullish trend but…..
- Potential 100-point Bordeaux 2022s
- Cos d’Estournel’s secondary market performance.
- Final Thought – Finding value in Bordeaux back vintages
Introduction
An uncertain period for the fine wine market
Trading activity dipped in April. Although fewer wines (LWIN11s) traded (-19.4%), the number with an active bid or offer against them remained stable (-1.9%), suggesting that buyers and sellers were at an impasse over price.
Something had to give, and it was the sellers who proved the more flexible.
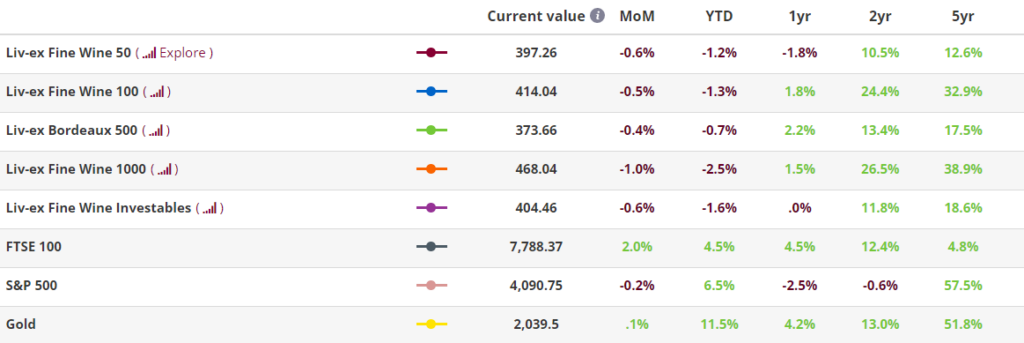
All the major Liv-ex indices fell in April. The Liv-ex Fine Wine 100 (the industry benchmark) fell 0.5%, more than unwinding the small gain made in March, while the Liv-ex Fine Wine 50 (Bordeaux First Growths) and the Liv-ex Fine Wine 1000 (the market’s broadest measure) were down 0.7% and 1.0% respectively.
The market’s increasingly reticent mood comes as the first Bordeaux 2022 En Primeur releases are announced. In our extended report on the region we look at the considerable challenges facing this year’s campaign.
The one Liv-ex 1000 sub-index to hold its ground this month was the Bordeaux Legends 40 (0.0%), suggesting that buyers retain some confidence in the value of back-vintages.
As the final section of our report highlights, the 1994, 1995, 1996, 1997 and 1999 vintages are currently available for less than the 2021 (on average). While 2022 may well be considered one of the truly great vintages, the chateaux might wish to keep this fact and the broader economic picture in mind when pricing their wines. Most of the great vintages of recent years have yielded little to no return for collectors who are increasingly questioning the need to buy wines En Primeur.
* All Liv-ex indices are calculated using our Mid Price; the mid-point between the highest live bid and lowest live offer on the market. These are the firm commitments to buy and sell at that price; transactional data rather than list prices. It represents the actual trading activity of 620 of the world’s leading fine wine merchants. Because Liv-ex doesn’t itself trade, this data is truly independent and reliable.
Major Market Movers – Barolo
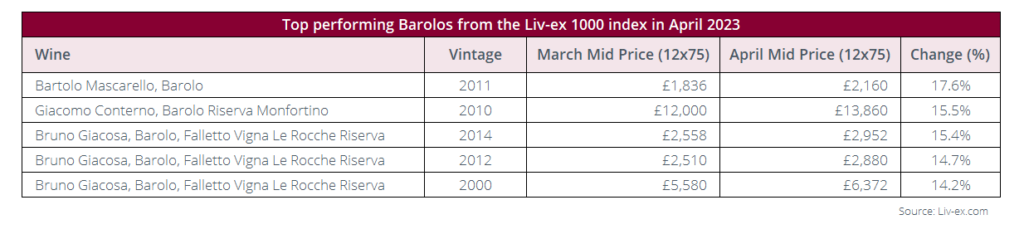
Although the Liv-ex 1000 sub-indices were weighed down by a darkening mood, some wines did see positive moves. One region in particular was Barolo. The table above shows the top price performers from the region in April. Bartolo Mascarello Barolo 2011 was in the top spot, up 17.6%.
It was followed by Giacomo Conterno Barolo Riserva Monfortino 2010 (15.5%). The wine has been highly praised by critics, with Antonio Galloni (Vinous), James Suckling and Monica Larner (Wine Advocate) all awarding it 100 points.
Meanwhile, three vintages of Bruno Giacosa Barolo Falletto Vigna Le Rocche Riserva were also on the list: the 2014 (15.4%), 2012 (14.7%) and the 2000 (14.2%).
Chart(s) of the month
Technical Analysis of the Left Bank 200 index
What is technical analysis?
Technical analysis is a method of forecasting future movements by looking back. The theory being that historical trading activity can be a valuable indicator of its future price movements.
Long-term trend is very bullish
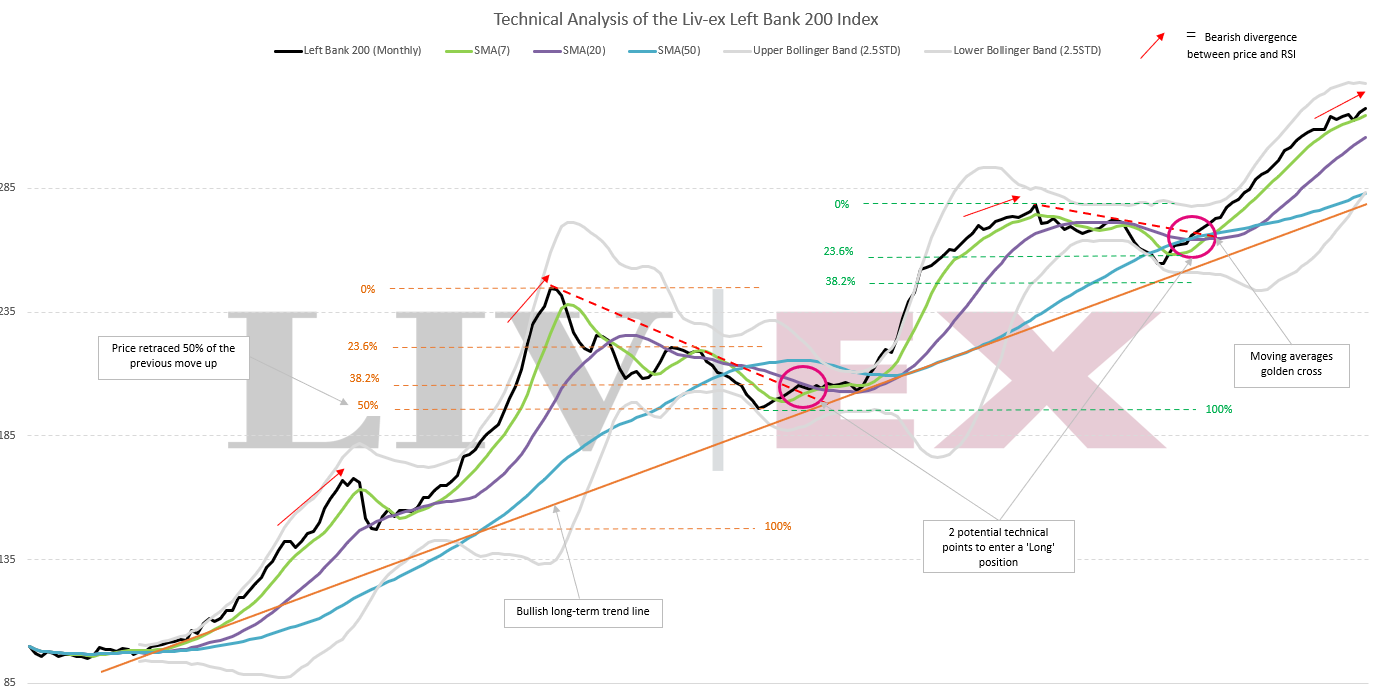
In line with the broader fine wine market, the Liv-ex Left-Bank index has been in a bullish trend since its inception. The trendline since 2005, rises at a steady 45-degree angle.
However, it has not been without interruption. While the monthly chart shows that the Left-Bank 200 index has consistently made higher highs and higher lows, these lows have been deeper than those seen in other indices.
Since inception, the index has seen three corrective phases (2008, 2011-14, and 2018-20) with price retracing at least to the 23.6% Fibonacci level and even to the 50% level in 2014 (admittedly, not a ’true’ Fibonacci retracement level).
It is notable that prices broke below the 50-month Simple Moving Average (SMA50) on several occasions, which is unusual among the Liv-ex indices we have, so far, analysed.
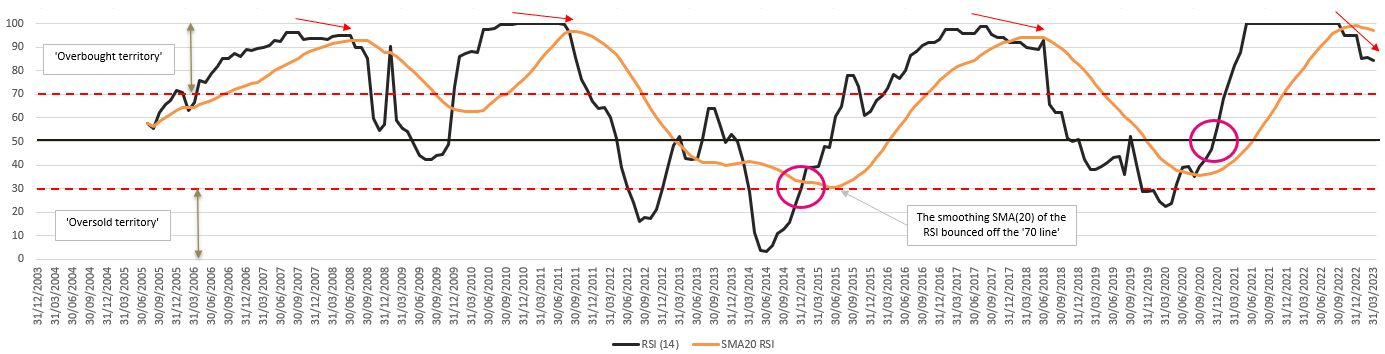
This more volatile price action is reflected in the RSI too. The chart of the Relative Strength Index (RSI) shows that the momentum of the price has been volatile, moving from extremely overbought to extremely oversold, and spending more time in the ‘oversold territory’ than other Liv-ex indices. In order to smooth the movements of the momentum indicator, we have added an SMA20 of the RSI itself. Interestingly, the RSI SMA20 never ventured into oversold territory, evidencing the underlying bullish long-term momentum.
Volatile prices can provide buying opportunities and technical analysis can help identify them. We have highlighted two such opportunities to buy the Index: in Q1 2015 and in Q4 2020 (circled in pink on the chart). During these correction phases prices made lower lows and lower highs. We have drawn a downward-sloping line from the recent major tops across the lower highs. When prices break upwards through these trendlines (red dashed lines on the chart), we are given our first buy signal.
We then look at other indicators:
- the RSI is moving out of its oversold acceleration zone and goes up
- are the SMAs rising and properly aligned (i.e. SMA7 on top of SMA20, themselves on top of the SMA50)?
- are the Bollinger Bands (BB) opening up or still contracting?
If these indicators support the resumption of the bullish trend, the index can be bought. Note, for example, the SMA7 & SMA20 golden cross in December 2020; this is a powerful buy signal, which provides significant confidence when combined with the trendline break up and the widening of the BB.
Is a correction imminent? The index has now been climbing for three years since the end of the previous correction. Prices are showing few signs of fatigue continuing to ride on top of its SMA7, the most sensitive of the SMAs. Bullish momentum has been solid as evidenced by the steep rise of the RSI from December 2020 but has been plateauing at overbought levels for the last 2 years.
The price action in the three months to the 31st March 2023 has produced a bearish divergence with the RSI. While all previous tops in the index have exhibited bearish divergences before correcting, we also know that ‘a bearish divergence can last longer than an investor can remain solvent’. So, this sole divergence is an alert but is not sufficient to trigger a ‘sell’ trade. This said, the upper BB is flattening and could serve as resistance to future price increases.
Invalidation of the bullish trend:
- price convincingly breaking below the SMA7; and
- price breaking below the SMA20 as well, with
- the SMA7 and the SMA20 crossing to the downside.
We will watch to see whether the RSI breaks through the ’70 line’ and how it behaves post such a break.
Critical Corner
100-point Bordeaux 2022 wines so far
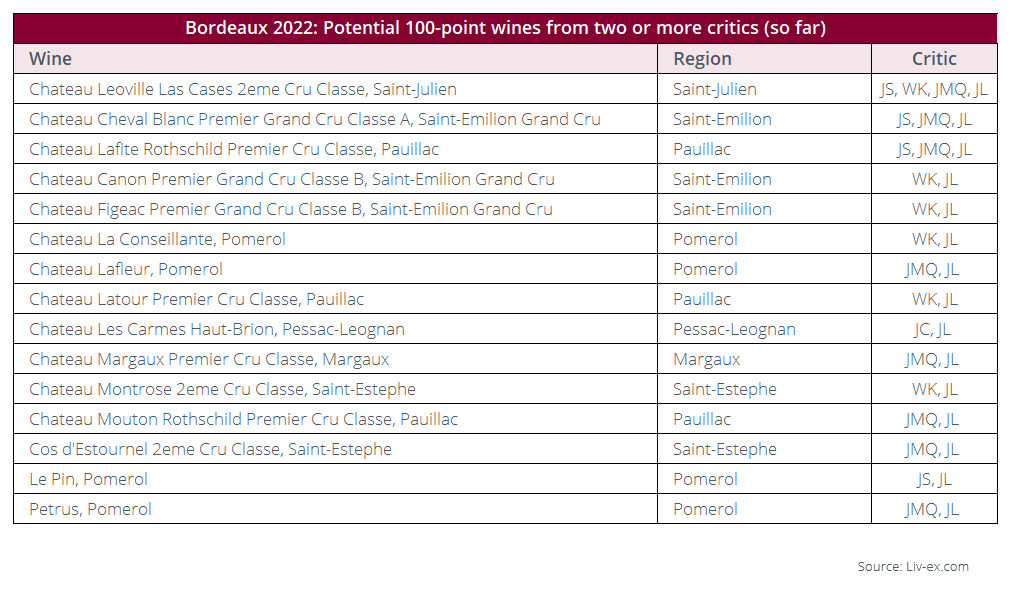
*Data correct as of Thursday 4th May. Critics shown include: James Sucking (JS), William Kelley (WK), Yohan Castaing (JC), Jean-Marc Quarin (JMQ) and Jeff Leve (JL),
The table above shows the Bordeaux 2022 wines that have received a potential 100-point score from at least two critics (so far). There is unanimous praise was for Leoville Las Cases, which has received (potentially) 100-points from all four critics to have (for now) published their thoughts.
William Kelley thought Leoville Las Cases was a contender for ‘one of the wines of the vintage’. Jean-Marc Quarin said it was ‘the meatiest, most precise, deepest and most austere Léoville Las Cases I know.’
First Growth Lafite Rothschild and Saint-Emilion estate, Cheval Blanc also received potential perfection from three critics each.
From an appellation perspective, Pomerol has the highest-scoring wines, with four featuring in the list (Lafleur, Conseillante, Le Pin and Petrus). It is followed by Pauillac and Saint-Emilion, each with three wines represented.
(To keep up-to-date with the latest scores throughout the campaign, our critic scores grid compares the latest in barrel scores from sixteen Bordeaux wine critics).
News Insight
Cos d’Estournel acquires Chateau Cos Labory
Last month, it was announced that St Estephe 1855 Fifth Growth Chateau Cos Labory was acquired by Michel Reybier and his family, owners of the neighbouring domain Chateau Cos d’Estournel.
In light of this news, we thought a quick look at the performance of Cos d’Estournel on the secondary market over recent years might be of interest.
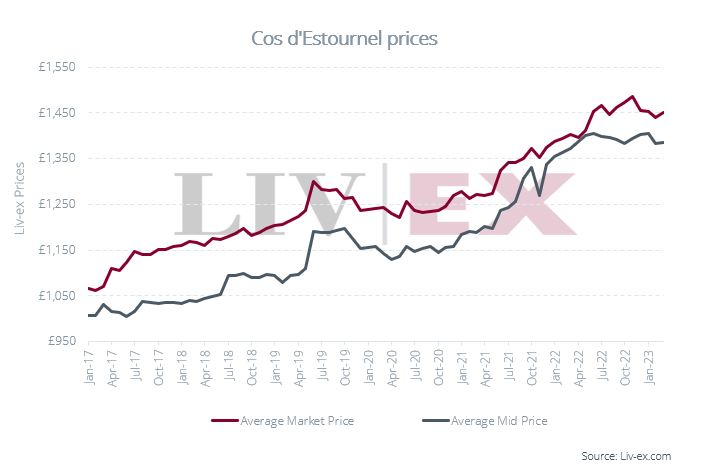
*Prices shown are Liv-ex Market Prices and Liv-ex Mid Prices, based off 2010-2021 vintages.
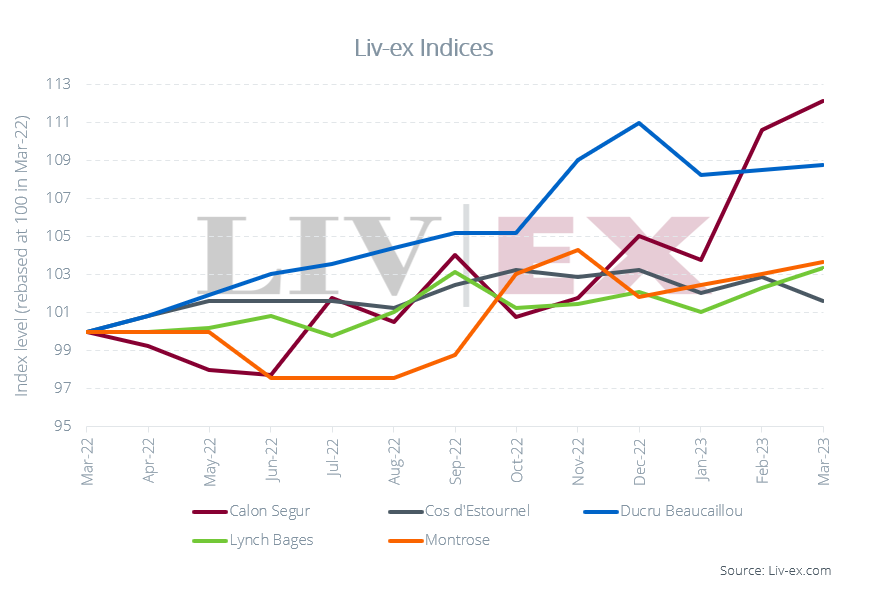
Since 2017, Cos d’Estournel’s average trade price has risen from £1,271, to £1,469. However, compared to a sample of its peers, the Chateau has been a laggard. Over the past year, the Cos d’Estournel index has risen by just 1.6%. By comparison, Calon Segur and Ducru Beaucaillou are up 12.1% and 8.0% respectively.
However, as highlighted in our Bordeaux 2022 report, underperforming wines might point to potential value within the region. Buyers looking for opportunities among Cos d’Estournel back-vintages can explore more via the Fair Value Tool.
Final thought
Finding value in Bordeaux back vintages
With the new crop of wines now tasted, the global fine wine trade has turned its attention to the heart of the matter – the question of release prices. Colin Hay recently reported the following for the Drinks Business:
‘The négociants that I speak to are expecting increases in release prices of around 20-25 per cent (in €s) on average with the anticipated range of release price increases being between 10 and 35 per cent or so (for the classed growths and their peers, rising towards the top). La place is anxious about such potential price increases, given the difficult prevailing market conditions, and the négociants have been lobbying strenuously behind the scenes since Vinexpo Paris (if not before) to exert a downward pressure on release price inflation (contrary to what some commentators seem to suggest).’
Our Bordeaux 2022 report delves deeper into the changing En Primeur system and the factors and strategies influencing recent campaigns’ pricing.
We noted that the current system is very much geared towards the chateaux (it is their wine after all), who in turn are keeping the supply chain (relatively) happy by allocating them a fixed margin. But perversely, the ultimate supplier of capital to the system, the collector, is paying the price as the returns from buying and storing wines are gradually eroded (as the chart below shows).
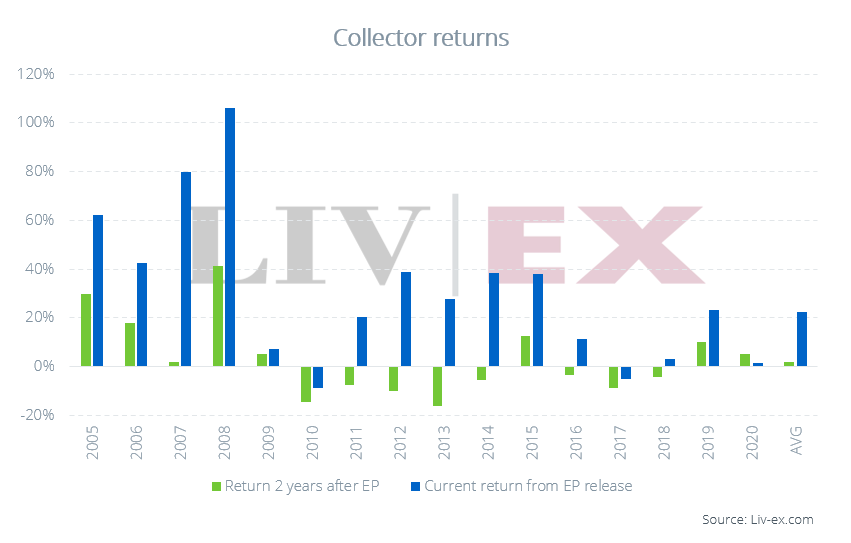
Feedback from Liv-ex members also suggests that collectors are increasingly taking part in EP campaigns through habit, for the ‘experience’ or simply to request big bottle formats. Some noted that the next generation of buyers, far more used to transparency and free flowing information, are already growing skeptical of the process, particularly given the limited upside and opportunity cost involved.
Ultimately the choice of whether to buy or stand aside lies with the collector. Those that are in it for the experience (and the choice of bottling format) might not be phased by the anticipated price rises, but to a new generation of informed collector who has experience and access to other markets and to whom transparency is not just commonplace, but fundamental to confidence, this might all seem too complex and risky an affair. Do they need to buy today, or can they afford to wait? Much of the data suggests the latter.
Finding value in back vintages
If the collector does choose to wait this one out, it may be interesting to offer them older vintages of Bordeaux currently available on the secondary market.
The chart below shows the average Market Prices of 30 Bordeaux vintages (1991-2021) compared to their average critic scores (Robert Parker until 2013 and Neal Martin until 2021).
According to Liv-ex’s ‘Fair Value’ methodology, prices are 57.7% correlated to these critic scores. The methodology hypothesises that, over time, wines will tend toward their ‘Fair Value’ price. Typically, though not always, the most ‘undervalued’ wines provide the best returns as the price moves up to ‘Fair Value’ in the secondary market, whereas ‘overvalued’ wines provide the worst return.
As such, the vintages below the trend line might offer relative value compared to their peers.
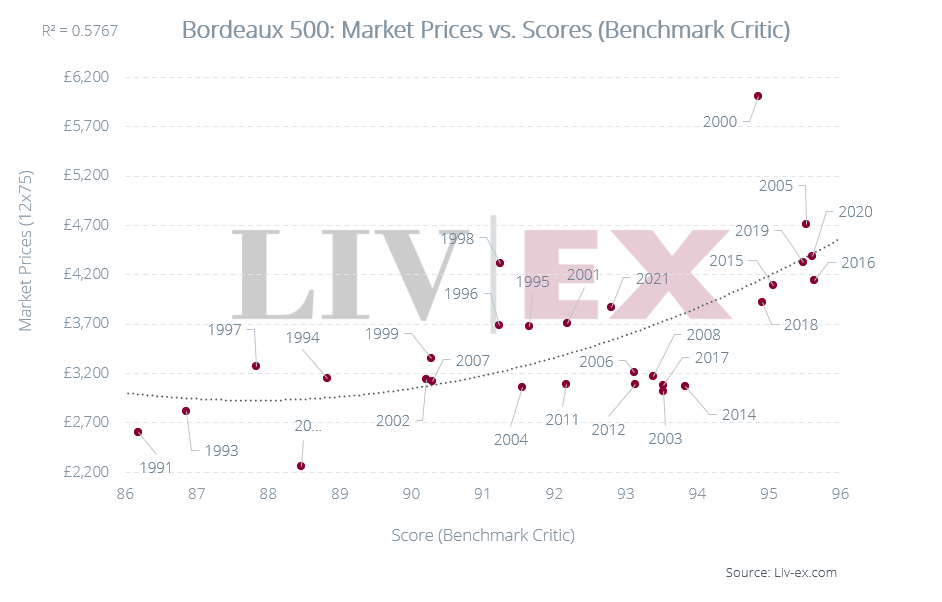
*Average scores are the most recent ‘Benchmark Critic’ scores. i.e. Robert Parker (1991-2013) and Neal Martin (2013-2021) scores (from Vinous and the Wine Advocate) for the 50 wines found in the Bordeaux 500 index. Prices shown are the average Liv-ex Market Prices. The Market Price is the best listed price for a wine in the secondary market. Unless otherwise stated, it is standardised to 12x75cl.
Interestingly, many of the vintages that fall below the trend line are from relatively recent ‘off’ vintages, such as 2003, 2004, 2006, 2008, 2011, 2012, 2013, 2014 and 2017.
From the ‘on’ vintages, 2018 and 2016 also notably feature just below the line, while 2015, 2019 and 2020 are just below too.
Despite falling above the trend line, in absolute terms, some older vintages might offer better alternatives for those looking for wines with bottle age that are within their drinking windows.
For example, the 1995 and 1996 vintages are available (on average) for less than the 2021 vintage. Buyers can also find 1998 Bordeaux for less than 2020.
Liv-ex Bordeaux 2022 En Primeur coverage
Liv-ex will be publishing release posts for a range of tools and insights surrounding the En Primeur campaign. Our Bordeaux 2022 pages contains links to key prices, critic scores, and reports and release blogs.
You can sign up to receive email alerts whenever analysis is published to avoid missing out.
Liv-ex analysis is drawn from the world’s most comprehensive database of fine wine prices. The data reflects the real time activity of Liv-ex’s 620 merchant members from across the globe. Together they represent the largest pool of liquidity in the world – currently £100m of bids and offers across 16,000 wines.