- Great 2005 Bordeaux wines are entering their drinking windows.
- Collectively, their prices have fallen sharply since late 2022.
- But March’s rise in the Liv-ex Fine Wine 100 was partly fuelled by great Bordeaux vintages.
- What can technical analysis tell prospective buyers of 2005?
In the May Market Report, we reported that March had seen the Liv-ex Fine Wine 100 rise for the first time in a year. The uptick was buoyed, in part, by the performance of its Bordeaux components ahead of En Primeur. Most of these are from great vintages like 2005, 2009, 2010, 2016 and 2019. As buyers of Bordeaux compare the relative value of the 2023 releases with those of comparable back vintages, we take a look at the 2005 vintage; in particular, the 50 leading wines from the region that make up the Liv-ex Bordeaux 500 index. Among them are Chateaux Ausone, Cheval Blanc, Clinet, Haut-Brion, Lafite Rothschild, Pontet Canet, Le Pin and Petrus.
Many of these wines are now entering their drinking windows. These windows should remain open for two decades or more presenting buyers with options to drink or hold. So what can their recent price performance tell today’s buyer about their likely future trajectory? Our Technical Analyst takes a look at a specially created index of these 50 2005s.
The index’s value has doubled since 2006 with some clear peaks and troughs during that time. Today’s value is down 11% since the peak in September 2022. The previous trough was in April 2020, and the index’s retracement since its peak has taken it almost halfway back to this level. Importantly, price remains above the long-term horizontal trendline around 183. The upward break of this trendline in April 2021 signalled the next bullish phase for the Index. Price is currently correcting within this phase.
Momentum has been bearish since the 2023 peak following the significant bearish divergence between the price and the Relative Strength Index (RSI). The price even broke below the ascending medium-term trendline from the 2014 lows. This could indicate further downside, possibly to the 183 level (the horizontal trendline).
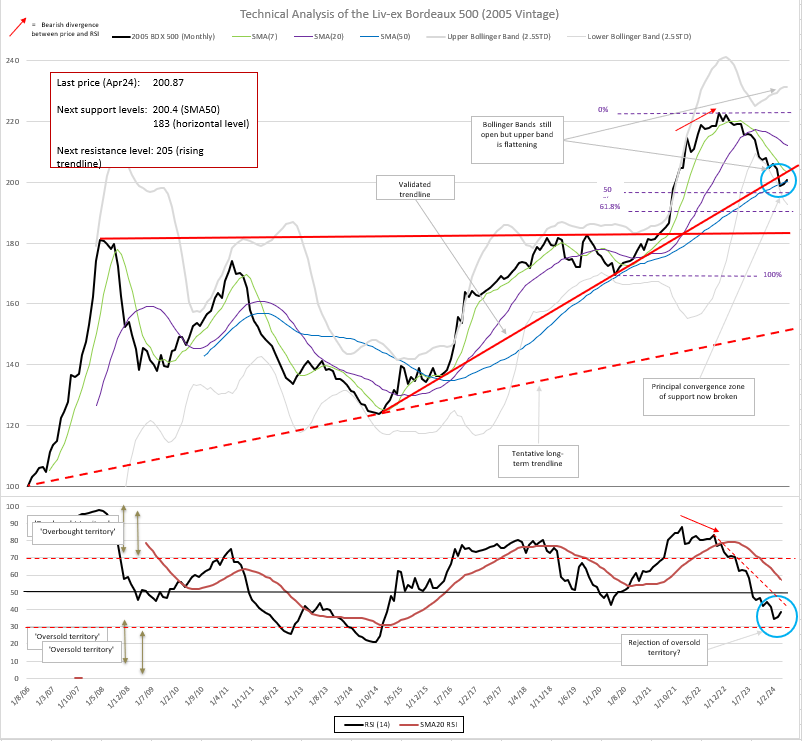
Immediate support is, however, provided by the Simple Moving Average 50 Months (SMA50). We generally view the SMA50 as an important technical support, which is often respected (eg. the re-test of the SMA50 in 2020). The price increased in the last two months and could give the Index some respite. We will monitor the price action if it re-tests the ascending trendline, and whether it breaks or rejects it.
Volatility could also decline in the coming months with the upper Bollinger Band now flattening, even though the lower band remains widely open. The RSI has evolved in line with the price in recent months and is showing no sign of divergence. As with the price action, we will monitor the RSI if it improves to re-test the ’50 line’, and whether it breaks or rejects it.
At this juncture, we would favour a rebound from the SMA50. However, considering the ascending trendline positioned just above the price, 1) the rebound could be short-lived, and 2) it is far too early to determine whether the correction initiated in April 2022 has concluded. A re-test of the ascending trendline followed by a decline into the 61.8% Fibonacci retracement (190) and then towards the long-term horizontal support (at 183) cannot be ruled out and would make sense from a technical analysis point of view.
As a Liv-ex member on Gold or Black package, you can use the Technical Analysis Tool to forecast future price changes and increase the probability of making more profitable trading decisions. You’ll find an explanation of the techniques and further resources and training links in this post; How to predict fine wine prices.