In this guide, we will show how technical analysis can help us design a trading plan, and how the analysis of price data over multiple timeframes can help to identify an optimal entry point. For the purposes of this analysis, we will be looking at the Liv-ex Fine Wine 50, which tracks the movements of First Growths, on a monthly, weekly and daily basis.
The monthly chart
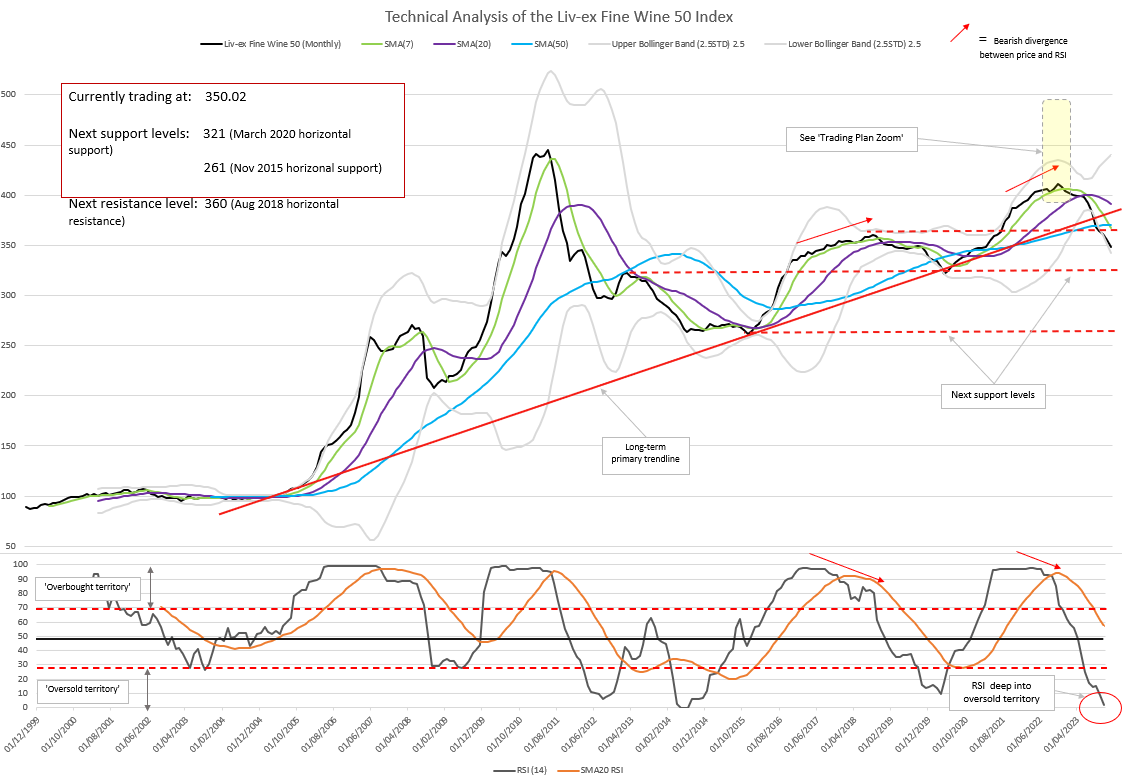
Above we can see that the price of the Liv-ex 50 has been falling since its top in September 2022. The recent price action broke not only through the Simple Moving Averages (SMA) 7 months and 20 months, but more importantly the SMA50 and the long-term primary trendline initiated in 2005.
This is a major threat to the index’s long-term bullish trend. We have not yet seen a re-test of the long-term ascending trendline; on the contrary, the price has now dropped below the 2018 highs.
Since its 2021/2022 highs, the Liv-ex 50’s price has so far seen a 15% correction. Was there any way we could have anticipated this drop and sell the Index or hedge long positions?
The Relative Strength Index (RSI) showed a bearish divergence with the Index price for most of 2022. A possible entry for a short position could have been when the RSI validated the divergence at the end of December 2022. Since then, the RSI plunged to oversold levels and remains extremely low. However, taking a counter-trend position on the back of a sole divergence when the market has been bullish for such a long time is risky, and technical analysts would prefer to see the price also confirming a trend reversal before doing so.
On the monthly chart, the ‘obvious’ signal to enter into a short position was the break of the long-term ascending trending line around 365 in July 2023. Let’s review the price action on the weekly timeframe to see if it presents earlier entry opportunities.
The weekly chart
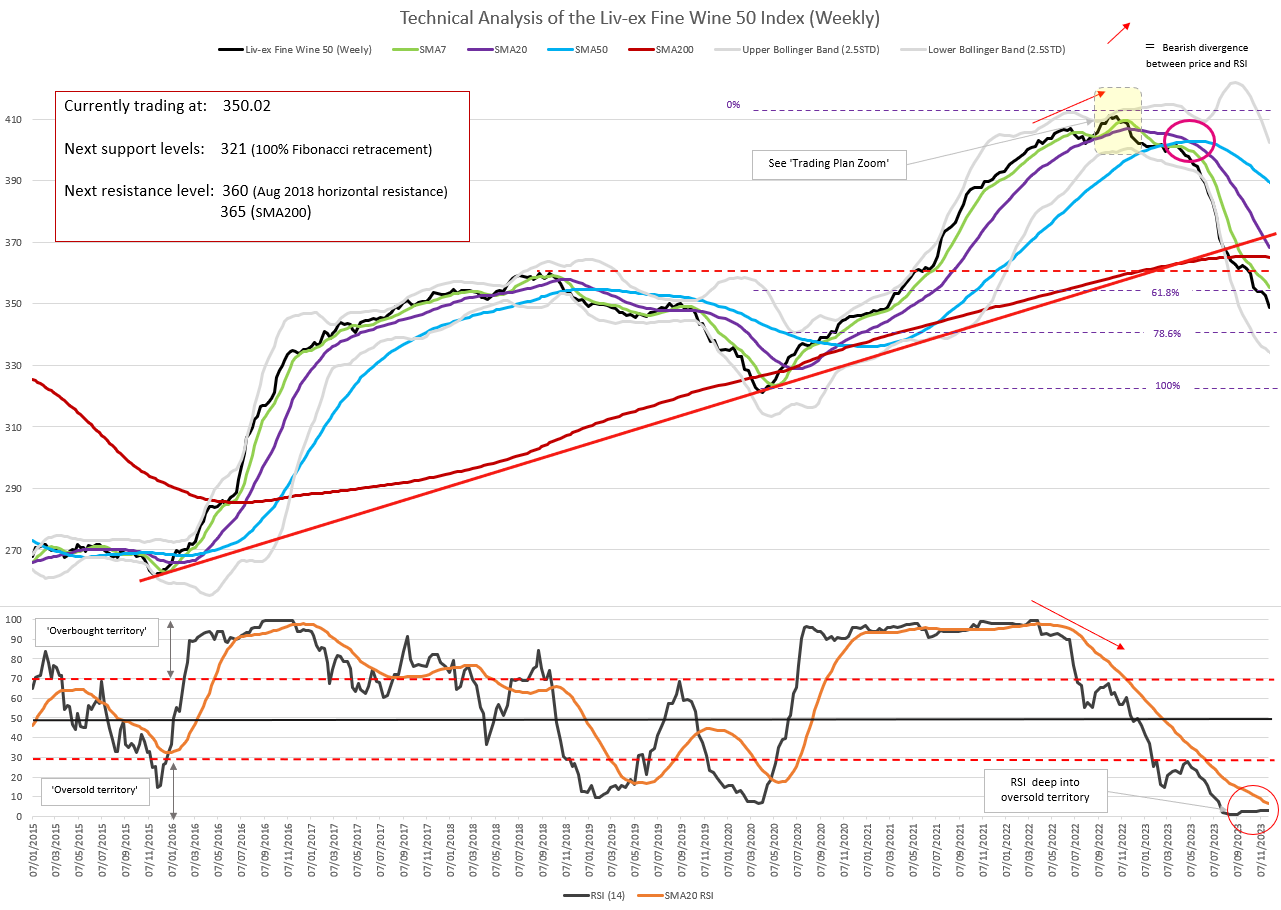
As discussed above, the index broke the long-term trendline to retrace beyond the 61.8% Fibonacci level of the recent move up (2020-2022). The bearish divergence observed on the monthly chart is also evident on the weekly chart and was validated in mid-July 2022, so much earlier than the monthly divergence. Again, technical analysts would not recommend selling the index solely on that basis, given the strength of the long-term bullish trend.
Analysts prefer to see some bearish signs in the price action instead of the deterioration in momentum alone. The bearish crossing of price and its SMA7 on the 1st of November could represent an aggressive entry point. Alternatively, a more conservative short entry would follow the bearish crossing of price and its SMA50 on the 28th of February 2023 or the dead cross sell signal in May 2023 (the SMA20 crossing the SMA50, circled in pink above).
Now, let’s look at the daily timeframe for more granularity to see if it presents earlier entry points.
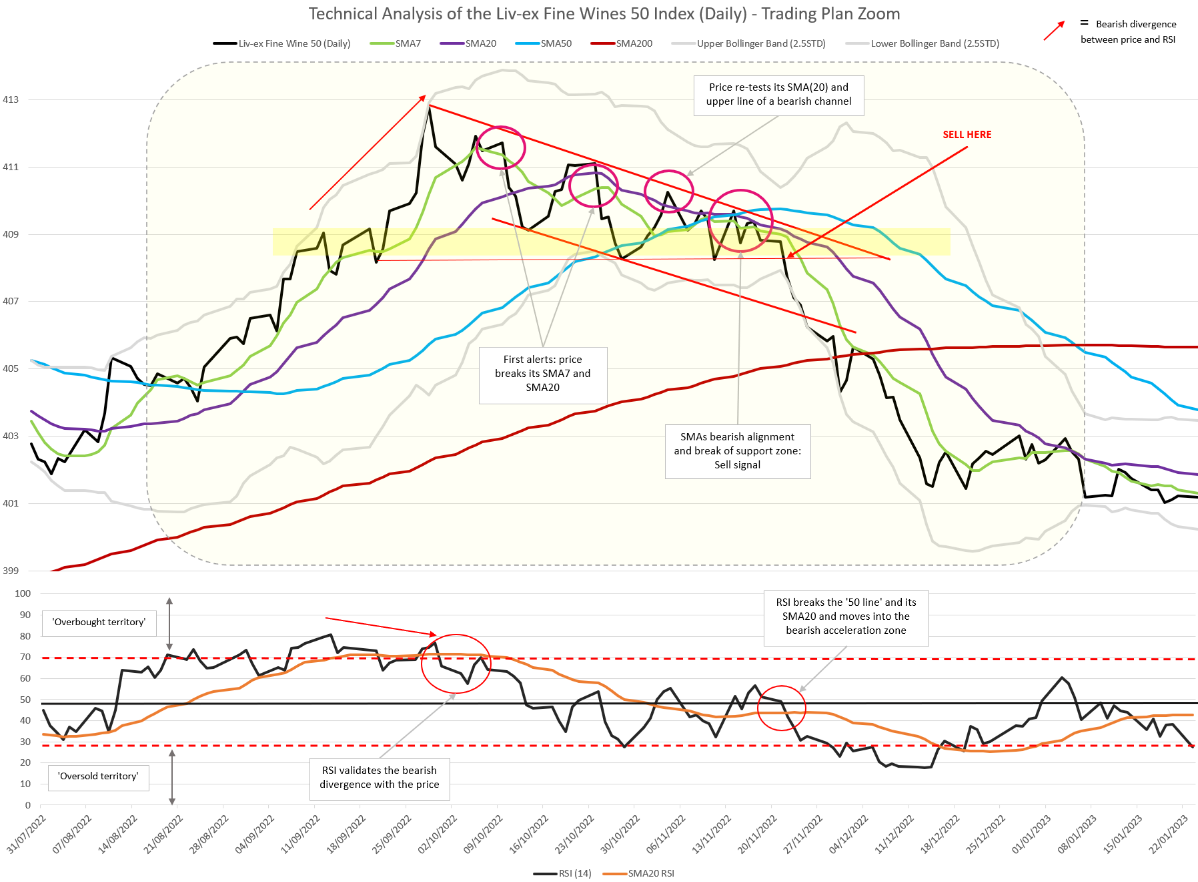
The daily chart – Timeline to implement a trading plan to sell the LX50
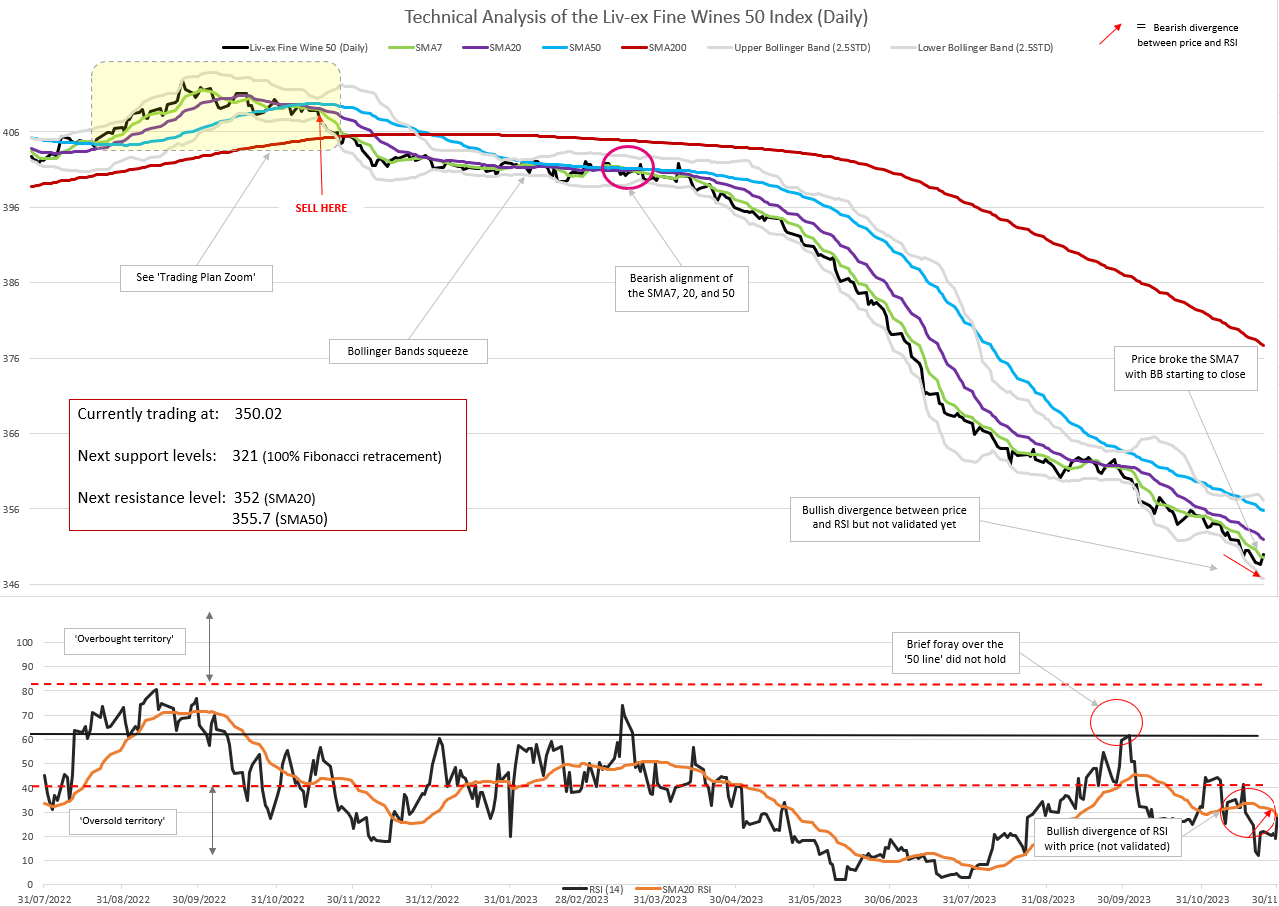
At the end of September 2022, we can see strong bearish divergence between price and RSI. From here, we will be trying to ascertain whether the ‘high’ of the 29th of September 2022 can be a potential price top. Subsequent price action (eg. a series of lower lows and lower highs, SMA bearish crossings, etc) will give us the answer:
- 30/09/22: The RSI bearish divergence is triggered.
- 4/10/22: Price breaks the SMA7.
- 6/10/22: The RSI re-tests the ’70 line’ (or overbought zone) and fails.
- 12/10/22: Price breaks the SMA20.
- 28/10/22: Price makes lower lows and lower highs (Dow theory), confirming a reversal of the short-term bullish trend.
- 4/11/22: Price re-tests the SMA20 and the top line of what is now a validated bearish channel.
- 11/11/22: Price re-tests the bottom of the horizontal support zone (in yellow) and, thereby validates the adjacent side of a descending triangle.
- 19/11/22: Price falls below the SMA7, 20, and 50, which alignment evidence bearish trending (dead cross).
- 22/11/22: Price breaks the triangle below the horizontal support of 408, and price accelerates downwards.
- Enter into a short position (sell) at 407.73.
- Stop Loss (SL) at the initiation of the trade = 413 (i.e. above the recent top)
- Take Profit 1 (TP1) = 385 (lower monthly BB); TP2 = 365 (long-term primary trendline); TP3 = 325 (slightly above March 2020 lows).
- Trailing SL = 362 (above the horizontal trendline)
What’s next from here?
At the end of November 2023, the short-term trend remains firmly bearish with no sign of reversal. The price has been closely trailing its SMA7 since mid-April 2023 with rare incursions above it. The lower Bollinger Band has guided the price lower too.
While still in oversold territory, recently the RSI has not dipped as low as levels seen in the summer 2023. It is currently showing a bullish divergence with the price, although that is not validated yet. We will monitor how this develops but technical analysts would not recommend trading (buying) on the back of it yet.
The analysis confirms the established bearish trend over the three timeframes, which agree with each other. There is very little upcoming technical support for the index before the 321 level, the 100% Fibonacci retracement. This will be our next target, unless we see evidence of a trend reversal.
In January, Liv-ex will introduce a Technical Analysis tool enabling members to conduct their own analysis on Liv-ex data.