September Market Report
- The decline of all Liv-ex major indices decelerated last month.
- The Bordeaux Legends 40 grew by 0.3% in August, buoyed by the relative rarity of the wines it contains.
- We turned to Technical Analysis to make sense of the Burgundy 150’s price movements.
- We take a look at Jane Anson’s top-scoring La Place Autumn releases and how they performed on the secondary market.
- Are ‘benchmark wines’ immune to market downturn, or are they dragging the pack down?
Introduction
How low can the market go?
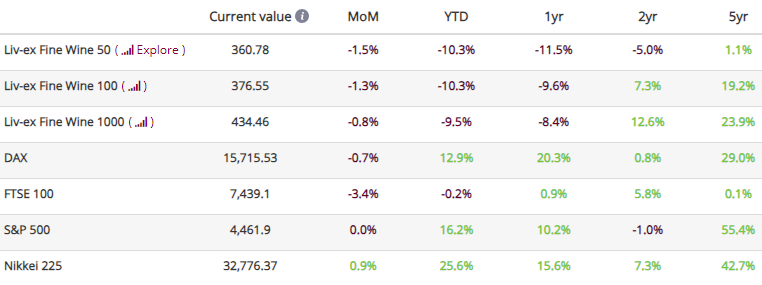
*data taken on the 13th of September 2023. FTSE 100 last updated on the 31st of August 2023.
The last update showed a deceleration in the decline of all major Liv-ex indices.
The Liv-ex Fine Wine 100, the industry benchmark, experienced a 1.3% decline from the previous month to close at 376.55. Similarly, the Liv-ex Fine Wine 50 (which tracks the movement of First Growths) fell by 1.4% month-on-month.
While the year-to-date trend remains bearish, it’s worth noting that the pace of decline across indices has slowed significantly. In particular, the Liv-ex Fine Wine 1000 slipped by only 0.8% last month, in contrast to its 9.5% decline since the beginning of 2023.
A soft market is, by definition, a buyers’ market, and it appears that buyers have stepped up their participation. August recorded increased trading activity, with trade by both value and volume showing an uptick. Market breadth also expanded, with 2,035 individual labels (LWIN 11s) trading on Liv-ex over the past month.
Is this deceleration a sign that the downturn is ending? Probably not yet. In this report, we’ve turned to historic data and technical analysis to try to understand just how far this decline can go, highlighting pockets of growth along the way.
* Liv-ex members can see price movements of individual wines in the LX100 in-app using the Indices Explorer.
Major Market Movers
The rise of the Bordeaux Legends 40
In contrast to the broader market’s decline, the Bordeaux Legends 40 index, a selection of 40 Bordeaux wines from exceptional older vintages, displayed positive monthly growth of 0.3% in August. This is especially noteworthy given that the three previous months saw the sub-indices of the Liv-ex Fine Wine 1000 either consistently decline or remain flat.
The interesting point about the Bordeaux Legends, and indeed all great wines with bottle age, is that there tend to be less of them around (many have already been drunk) and subsequently fewer sellers of them. This lends itself to outperformance in soft markets.
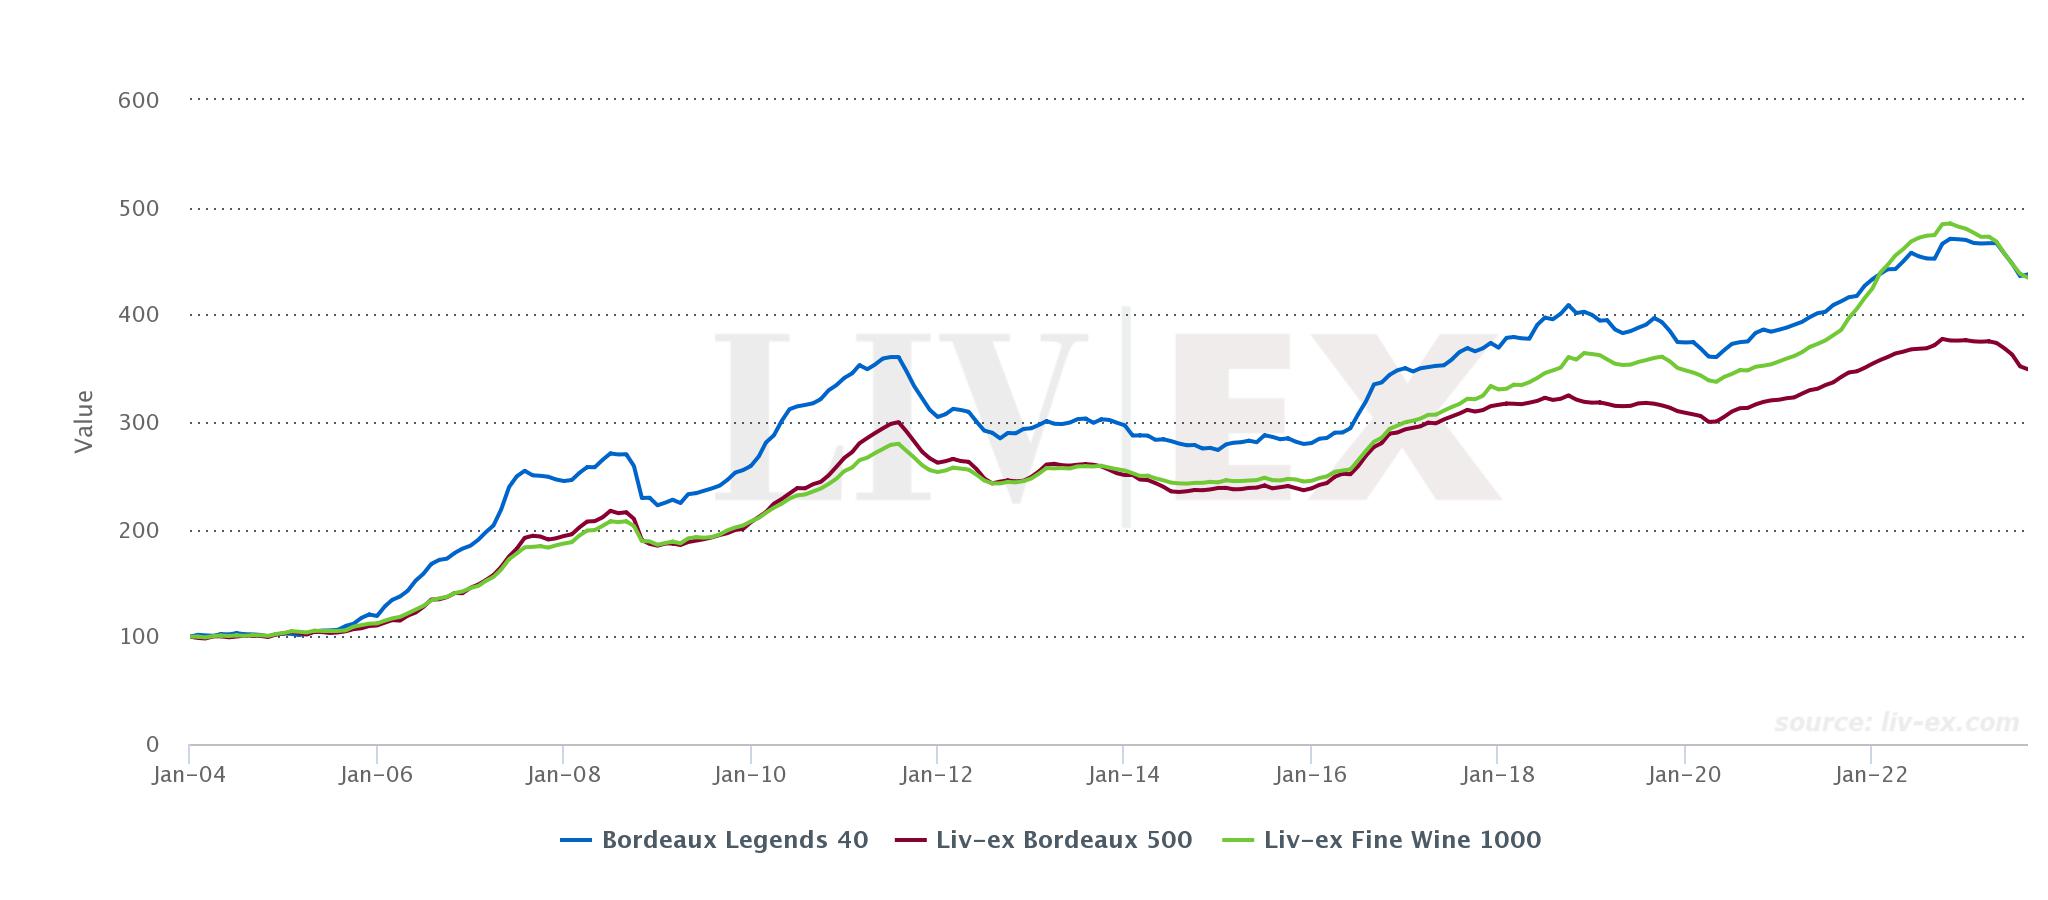
*Made with the Liv-ex Charting tool.
The chart above shows the performance of the Bordeaux Legends 40 index compared to the Liv-ex Fine Wine 1000 and the Bordeaux 500. The Bordeaux Legends 40 (represented by the blue line) has consistently outperformed the other two indices until January 2022, when the Liv-ex Fine Wine 1000 was driven higher by booming prices in both Burgundy and Champagne.
The slight rebound recorded by the Bordeaux Legends 40 last month and the slower rate of decline (-3.2% year-on-year compared to the Bordeaux 500’s -6.0%) indicate that the index is more resilient to downturns, buoyed by relatively low supply.
Chart of the Month
Where is the Burgundy 150’s safety net?
- Since our last analysis in March, the index has broken a few more of its support lines.
- While the long-term bullish trend is at risk, it is not yet broken.
- What are the next signals to look out for? Read more below.
The index’s bullish momentum is increasingly at risk
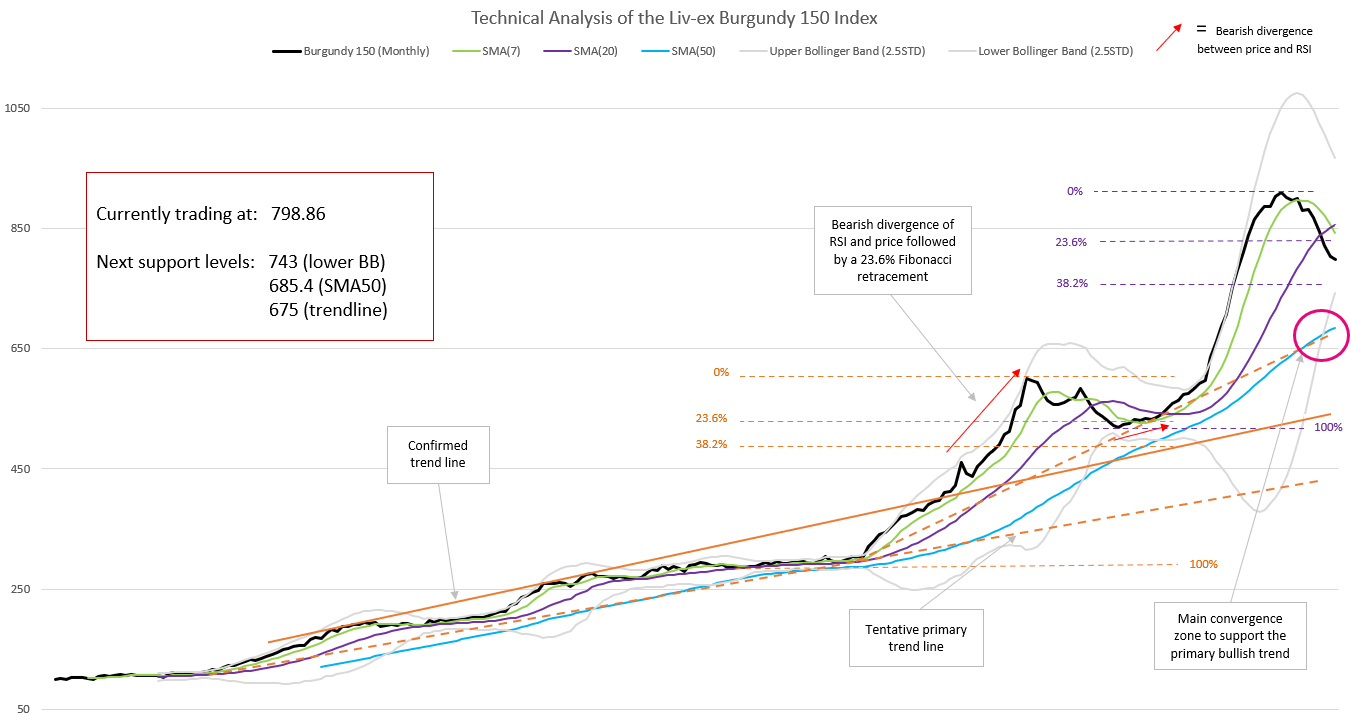
In our March Market Report, we noted that the Burgundy 150’s bullish run looked stretched. This was evidenced by significant ‘separation’ between the price and its medium-term 50-month Simple Moving Average (SMA50, in blue on the chart above), an indicator which charts the long-term trajectory of an index while ignoring the daily ‘noise’.
Two of three warning signs have materialised
Back then, we outlined three warning signs that the bullish momentum might end. The first is the index breaking below the SMA7, which it did shortly after our last update. Since then, the index has dropped close to 10%, breaking its SMA20 (the purple line above, which is still rising) in the process.
A further, more serious alert is a bearish crossing of the SMA7 and SMA20, which did occur last month, as shown by the purple and green lines crossing on the graph above.
The third warning sign, which is yet to manifest itself but would invalidate the index’s long-term bullish trend, is a break below the SMA50 (in blue above) and below the rising trend line (the orange dotted line above).
Bollinger Bands squeeze – the calm before the storm?
The index’s Bollinger Bands (in grey in the chart above), are closing rapidly, forming what is known as a ‘squeeze’. As Bollinger Bands are essentially standard deviations from an index’s 20-day SMA, they are used as an indicator of volatility.
Proponents of technical analysis believe that the closer the price is to the upper band, which had been the case for the Burgundy 150 for a considerable amount of time last year, the more likely the index is overbought. A tightening of the Bollinger Bands is taken to signal a period of low volatility. A squeeze can also be seen as a sign of future increased volatility, giving rise to trading opportunities.
The lower Bollinger Band at 743 could offer some initial support to the current price correction, particularly as it is converging with the 38.2% Fibonacci retracement, an indicator of possible support and resistance levels.
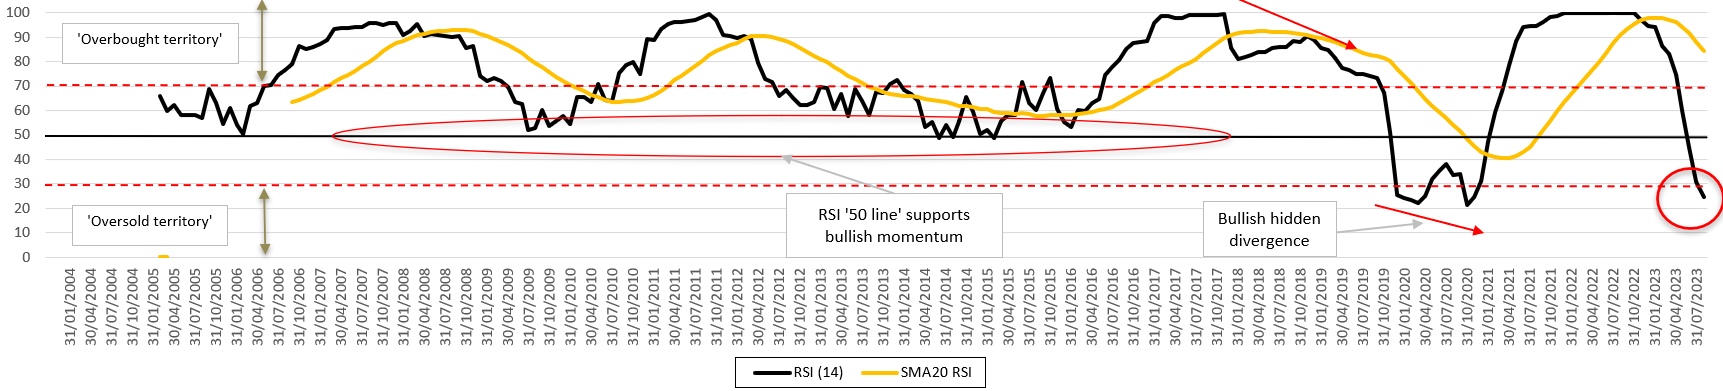
The Relative Strength Index (RSI, in black in the chart above) has been falling heavily since October 2022 and reached ‘oversold territory’ (below the 30 line) in August 2023.
Typically, an RSI below 40 (which it has been since spring this year) is viewed as a sign that the decline in price could accelerate. For that reason, proponents of technical analysis would expect the RSI to hover around the ’30 line’ and below for the next few months.
Will the index break its SMA50 and further threaten its bullish trend?
To conclude, the chart tells us that the Burgundy 150’s long-term bullish trend is becoming more fragile (as shown by the bearish crossing of the SMA20 by the SMA7), but it is by no means invalidated – yet.
A break below the SMA50 would be a more serious threat to the long-term trend, especially if accompanied by a break below the rising tentative accelerated trend line (circled in pink in the first chart).
What is technical analysis?
Technical analysis is a method of forecasting future market movements by studying previous movements, on the basis that historical trading activity can be a valuable indicator of the future This tool is common in financial markets and is applied here to Liv-ex indices in order to evaluate investments and identify trading opportunities.
Critical Corner
Jane Anson’s September Releases Report
In her recently published September Releases report, wine critic Jane Anson (Inside Bordeaux) assessed and scored a diverse selection of over 120 wines being released on La Place de Bordeaux this autumn. The list of wines scored will keep evolving throughout September as she continues her tastings.
In her report, she reassures buyers that despite the difficult 2020 harvest impacted by wildfires, Napa wine producers have been ‘extremely careful about what they put in the bottle’. She also commends the ‘exceptionally strong collection of Sicilian white wines from Carlo Ferrini and Giovanni Rosso’, further adding that ‘the Sicilian reds, as ever, offer some of the best value wines not just of the September Releases, but of the wine industry in general’. Furthermore, Anson highlights the emergence of Spanish wines within La Place de Bordeaux including Bodegas De La Riva Vino di Pasto San Cayetano, Macharnudo 2022 and Vinedos de Matallana Ribera Del Duero DO Matallana 2020.
Anson’s commentary touches upon the complex interplay of global economic factors impacting the fine wine market, and she acknowledges that ‘there’s no doubt that the wider economic stresses globally are both helping and hurting the September Releases’. In light of this, we analysed the critic’s scores for this year’s releases and looked back at some wines’ historic performances.
Jane Anson’s Autumn Releases scores
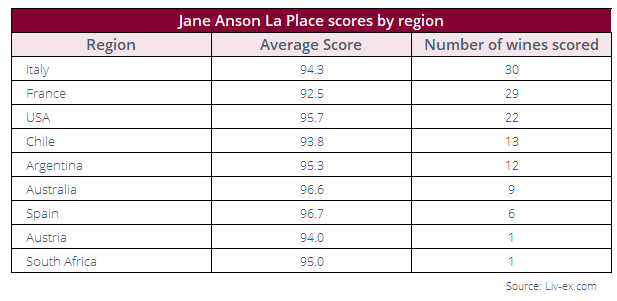
At the time of writing, Anson had scored 123 wines from around the globe: 30 from Italy, 29 from France, 22 from the USA. 13 from Chile, 12 from Argentina, nine from Australia, six from Spain and one each from Austria and South Africa.
In terms of scores, she has awarded three wines 100 point this year: Bibi Graetz Colore 2021, Yjar 2019, and Giaconda Chardonnay 2021. She has also awarded 99 points to La Place newcomer Chappellet, Pritchard Hill Cabernet Sauvignon 2019.
Her overall average score this year was 94 points. As shown in the table below, Italian wines have a higher overall score than French wines this year, while Argentina outpaces Chile in terms of average scores.
A glimpse into the past
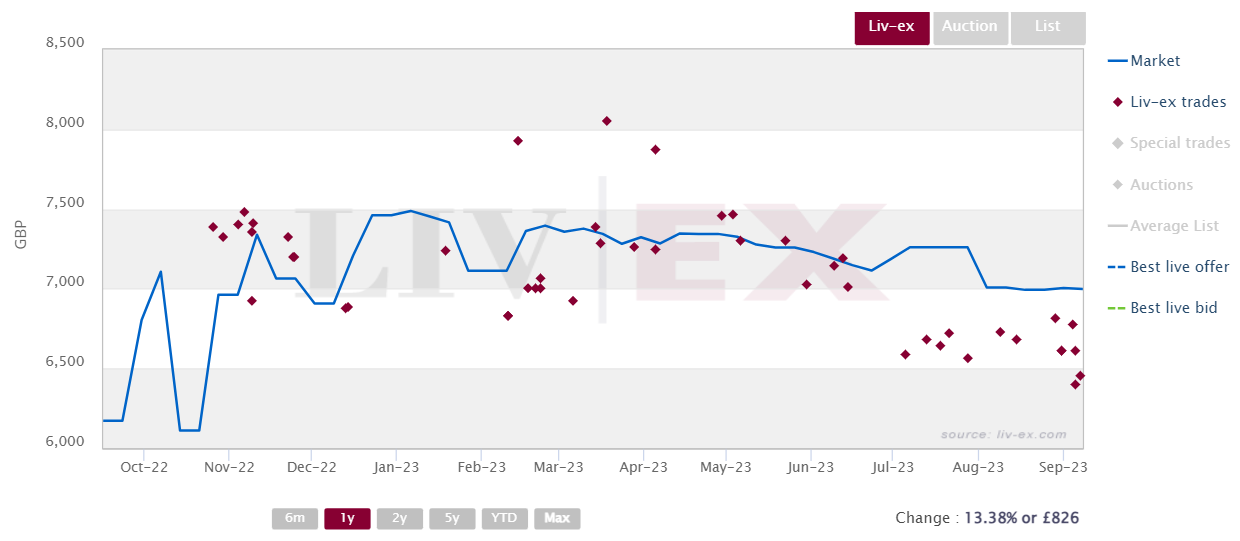
Last year, Masseto 2019 was offered internationally at a price of £6,250 per case of 12. At the time of release, it was among the best value wines on the market in comparison to older vintages. The wine has since traded on the secondary market post-release and has seen its value appreciate by 12.0%, with a current Market Price of £6,999 per case.
Interestingly, Masseto 2019 experienced heightened trading activity just before the release of the 2020 vintage, with a trade happening at £6,400 per case, below the wine’s Market Price. This may betray a feeling of nervousness from the market ahead of the new release.
Masseto 2020 received a score of 98 points from Jane Anson, one point shy of the 2019 vintage. With an international release price ranging from £6,800-£7,000 per case, Masseto 2020 is offered at fair value, according to Liv-ex’s Fair Value methodology. It will be intriguing to observe how this strategic release will affect its price performance in the coming year.
Masseto 2019 trades on Liv-ex
However, as shown in the table below, not all wines were released at ‘Fair Value’ last year. Many wines that were released at prices higher than the Market Price of previous vintages or at prices above the ‘Fair Value’ line have declined in value since their initial release.
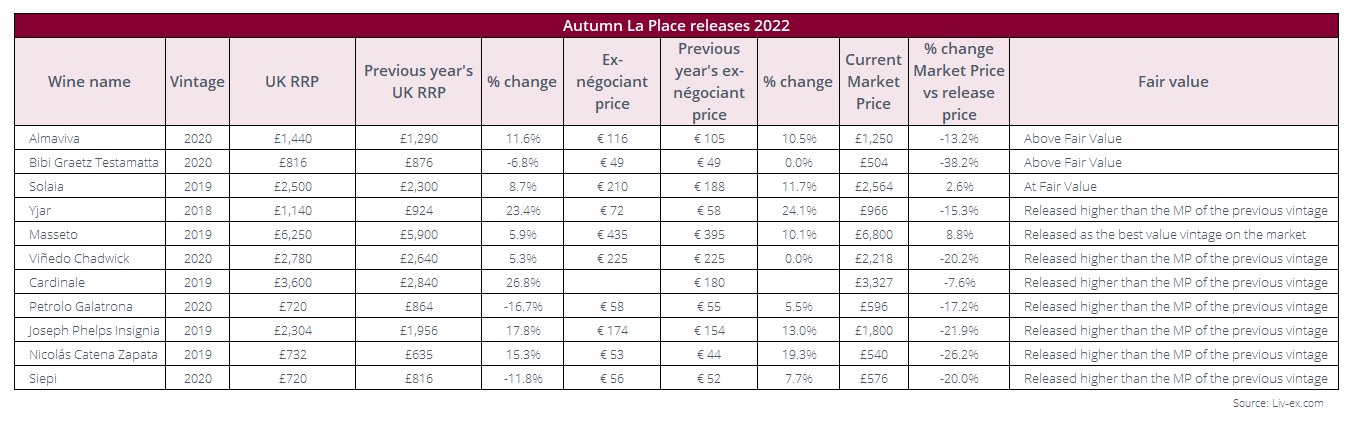
It thus appears that there is a correlation between wines released at fair value and subsequent increases in their Market Price, as shown by Masseto and Solaia, two of Jane Anson’s top ten wines this year. On the other hand, all the wines priced above Fair Value or higher than their back vintages have since seen a decline in their Market Price.
Furthermore, some wines released this year, again at prices higher than the Market Price of back vintages, have already traded below their release price. This includes Testamatta 2021, which despite being scored 100 points by Jane Anson and releasing close to the price implied by our Fair Value methodology, has traded 29.9% below its release price in the wholesale market. It is a sought-after wine, but previous pricing has seemingly confused the market, leading to price volatility.
La Place de Bordeaux is a unique distribution channel allowing winemakers to concentrate on making great wines, while the négociants see to it that their efforts are rewarded with an efficient route to market.
However, as has become abundantly clear with both the spring Bordeaux En Primeur releases and the autumn ‘Beyond Bordeaux’ releases, if the wines are priced incorrectly (ignoring the physical market), then, regardless of quality, they simply will not sell. Sadly, although these releases present a great opportunity to invigorate the market, many of these great wines remain on the shelf.
Final Thought
Will ‘benchmark wines’ ever fall from grace?
Back in July, the drinks business asked where all the benchmark wines had gone. The article rightfully pointed out that stratospheric price increases meant many of the world’s top wines, which also happen to be ‘benchmarks’ for a particular region, are completely inaccessible to most people, even sommeliers in training.
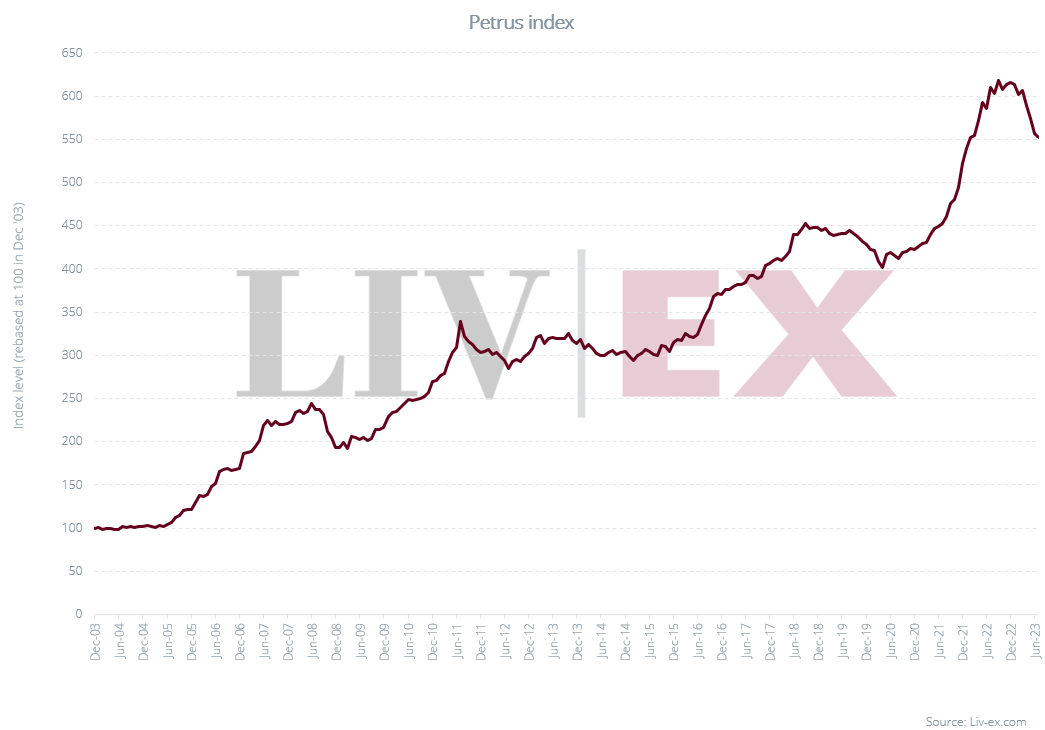
Pétrus, for example, has seen its value rise by 452.2% since the inception of its index in January 2003, as per the chart below. Despite a few dips and troughs, the wine’s price has steadily increased throughout the years and a bottle now retails for several thousand pounds a bottle.
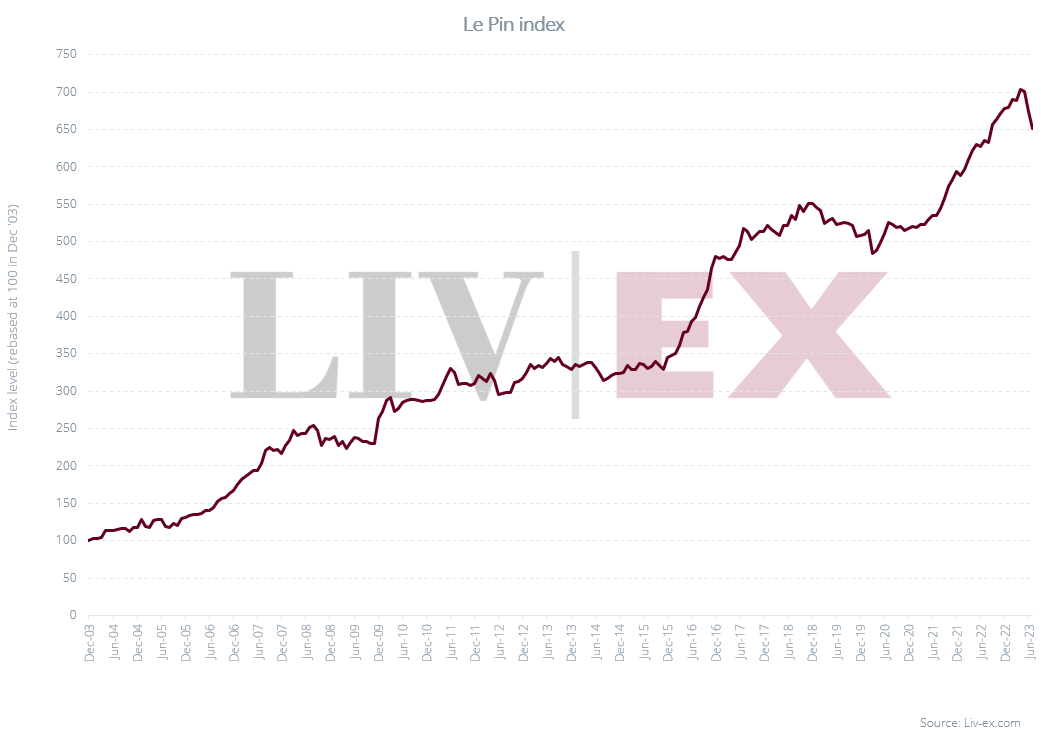
Le Pin, which is considered to be the benchmark for garagiste wines, displays this trend even more clearly, and has recorded a rise in value of 551.4% over the last 20 years, placing it firmly out of reach of all but a handful of buyers.
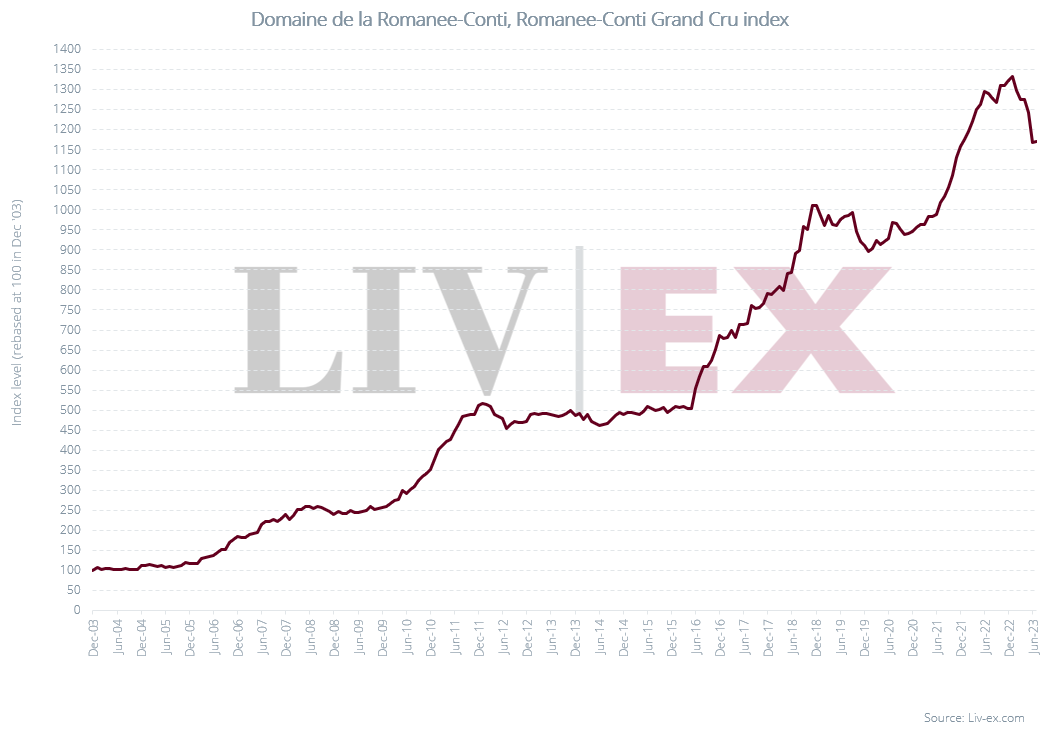
The picture is even more challenging in Burgundy, where Domaine de la Romanée-Conti has seen a rise of 1,071.7% since 2003. A single bottle, such as the 2018 vintage of Romanée-Conti, can cost upwards of £20,000.
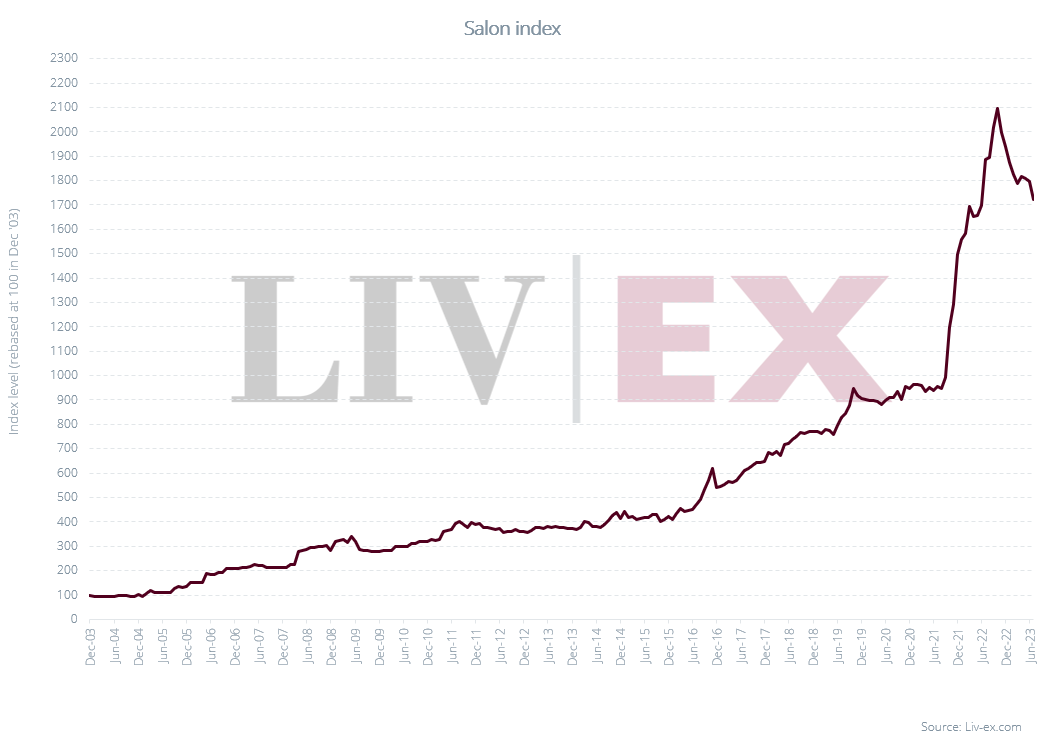
Salon, which is considered the benchmark Champagne, exhibits the steep rise in value in summer 2021 typical of wines from the region, which benefitted from a boost in demand post-Covid-19. The Salon index has risen 1,620.3% since its inception.
But while these benchmark wines have witnessed extraordinary price increases, as the charts suggest, they are not immune to the current downturn. The question that arises is this: at these elevated prices, where the air is thin and buyers are few and far between, might these benchmark wines lead the pack down, or does their relative rarity protect them from the rigours of market downturns?
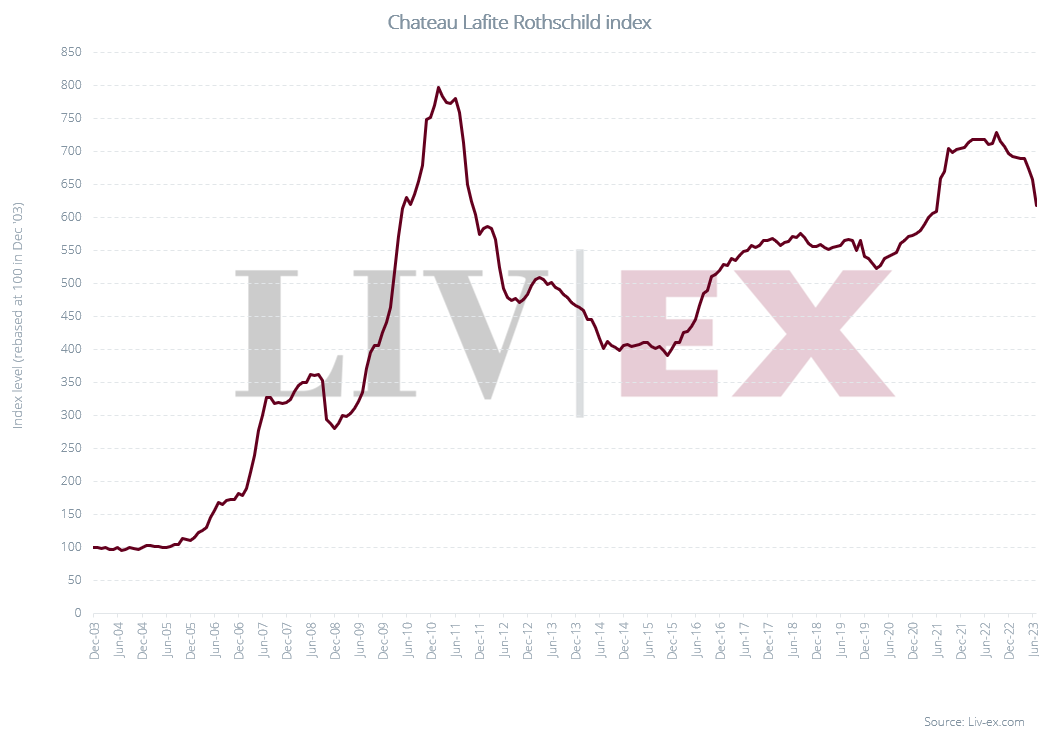
The case of Château Lafite Rothschild hints at an answer. During the Asia-led boom for fine wine (2005-2011), Lafite became a ‘super brand’ in China and prices skyrocketed, as shown on the chart below. When the market cooled, prices halved. In subsequent years Lafite found its footing and rallied hard, but it has yet to reach the heights achieved during these years of frenzied activity, suggesting benchmark wines aren’t immune to broader market machinations. Gravity can be a potent force.
The Liv-ex Classification 2023, which was released last month, supported this view to some extent.
On the one hand, we noted that the second tier of the Classification featured many new entrants from Burgundy. We posited that this influx can be attributed to a surge in demand in the summer and autumn of 2022, resulting in an expansion of the number of Burgundy labels trading as buyers sought wines that were relatively accessible (read; affordable) compared to the more established (benchmark) growers that are well out of reach for many.
On the other hand, the fact that the top tier of the Classification has remained broadly unchanged over time tells us that benchmark wines, far from drowning as the market broadens and the competition becomes fiercer, benefit from the greater transparency and liquidity an efficient market brings.
The extent to which benchmark wines will see their prices fall (and for how long) remains to be seen, but the broadening of the secondary market offers alternatives to buyers seeking more affordable alternatives in tougher times.