What’s happening in the market?
Bordeaux’s trade share has rebounded since last Friday; the region currently accounts for 42.7% of total trade by value. It was buoyed by six vintages of Pétrus trading, as well as Château Latour 1982.
Tuscany also recorded an uptick, accounting for 15.8% of trade over the last five days. The 2019 vintage of Tenuta San Guido Bolgheri Sassicaia was the most traded wine by value in that period and several vintages of Masseto also changed hands since last Friday.
Burgundy lagged behind, with 16.3% of trade by value, although it’s worth noting that that’s an improvement on the previous week when the region’s trade share dropped to 12.7.% Piedmont also lost some of the momentum it gained last week, its trade share falling from 4.0% to 2.8%.
Today’s deep-dive: Is Champagne’s downturn fizzling out?
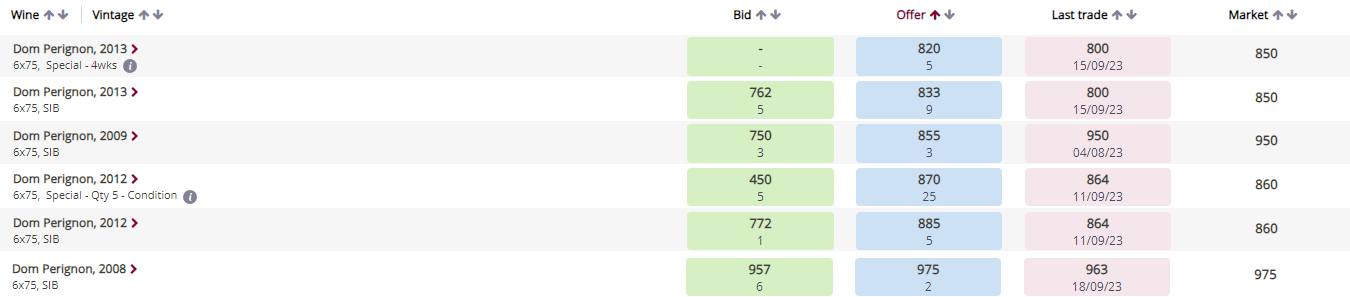
No wine illustrates the contrasting trends observed in Champagne better than Dom Pérignon.
Like all other indices year-to-date, the Champagne 50 has recorded a steady decline since its peak in October 2022. However, the region has been consistently active in terms of trade this year – Dom Pérignon 2013 is the most traded wine on Liv-ex this year by both value and volume.
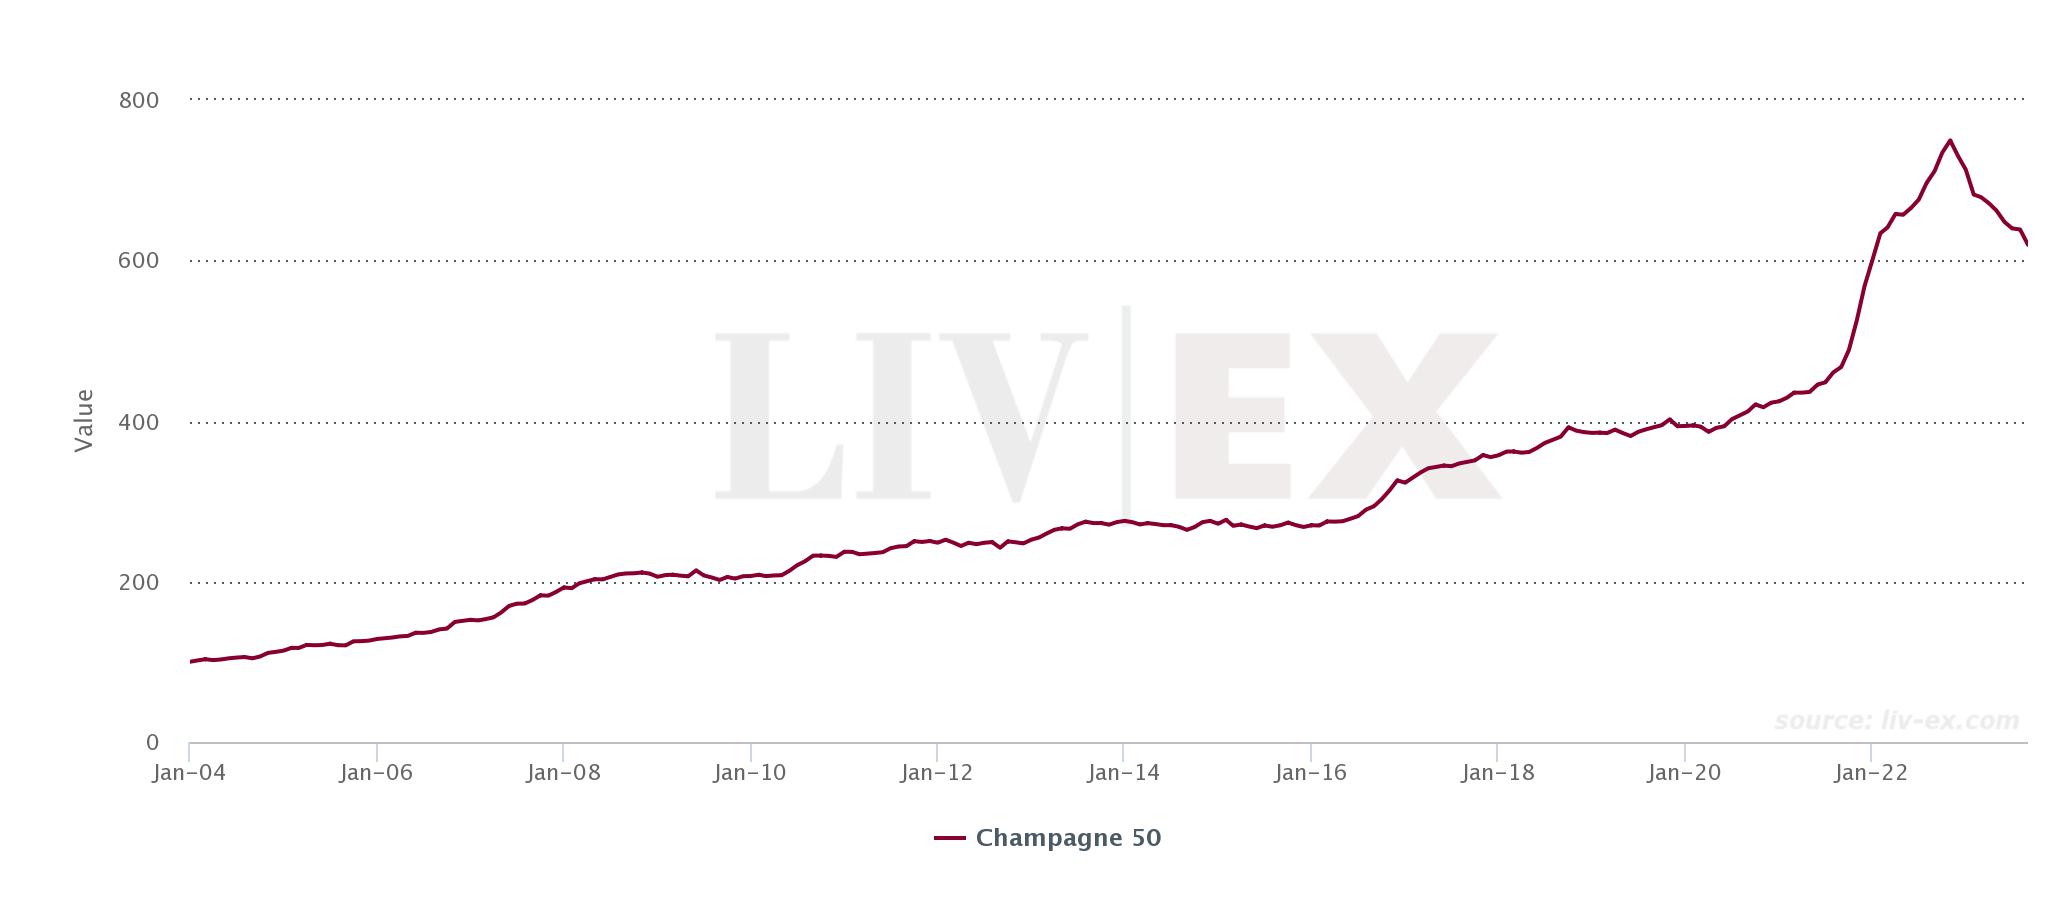
As shown in the chart below, the price of the Dom Pérignon index broadly mirrors the trend observed in the wider Champagne index. It has been steadily rising since inception and reached a peak in October 2022, following a steep acceleration from mid-2020.
Momentum was extremely bullish in 2020 and 2021 as prices soared rapidly, evidenced by the significant separation between the price and its SMA50. At the time, buyers were in search of relative value and found it in a series of great vintage releases, an opportunity to spend cash accumulated during pandemic-induced lockdowns.
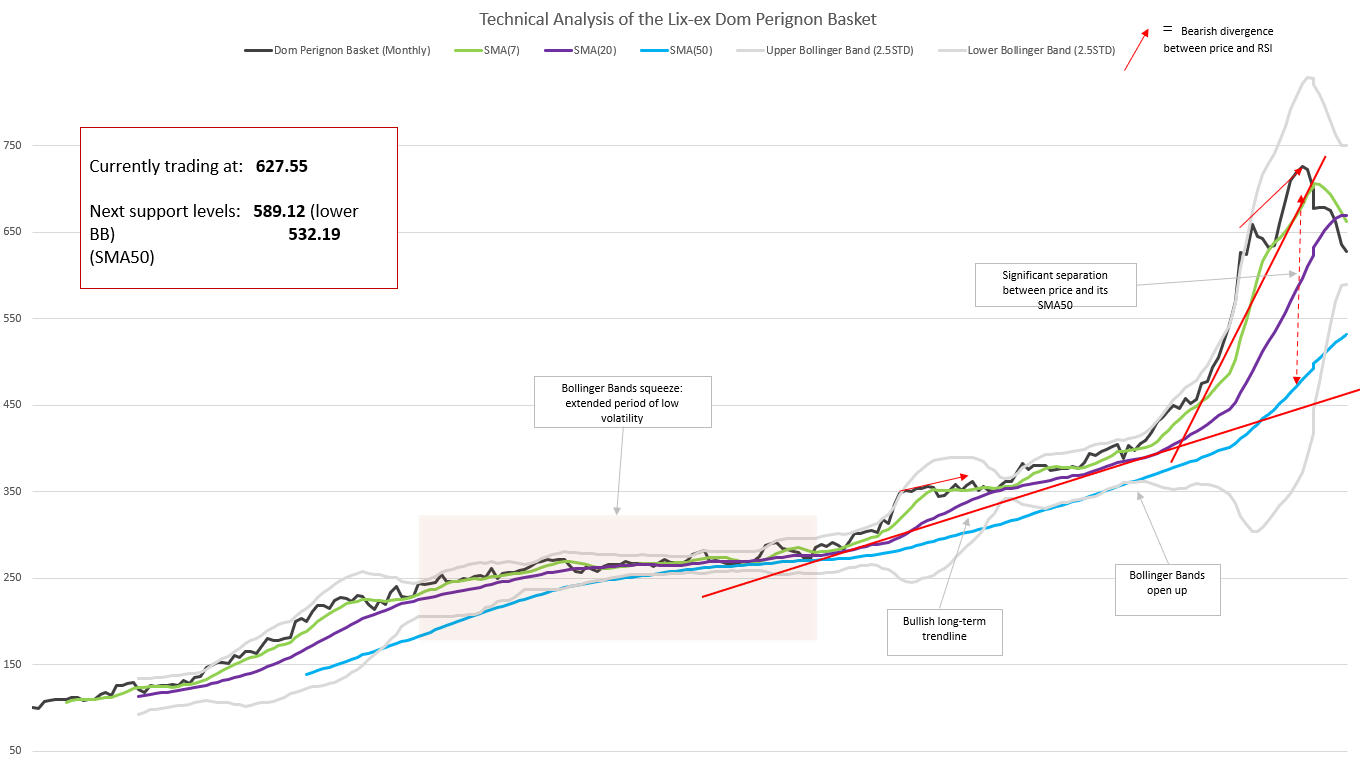
Since peaking, the price action of Dom Pérignon has been bearish, meaning it has consistently declined as market sentiment turned cautious. The index has retraced below its Simple Moving Average 7 months (SMA7, in green on the chart above) and the SMA20 (in purple on the line above).
Simple Moving Averages are calculated by averaging a selected range of prices over a period of time. As technical indicators, they usually indicate whether a price will continue on or change its trajectory – an index breaking its SMAs is a signal it may be reversing its long-term trend.
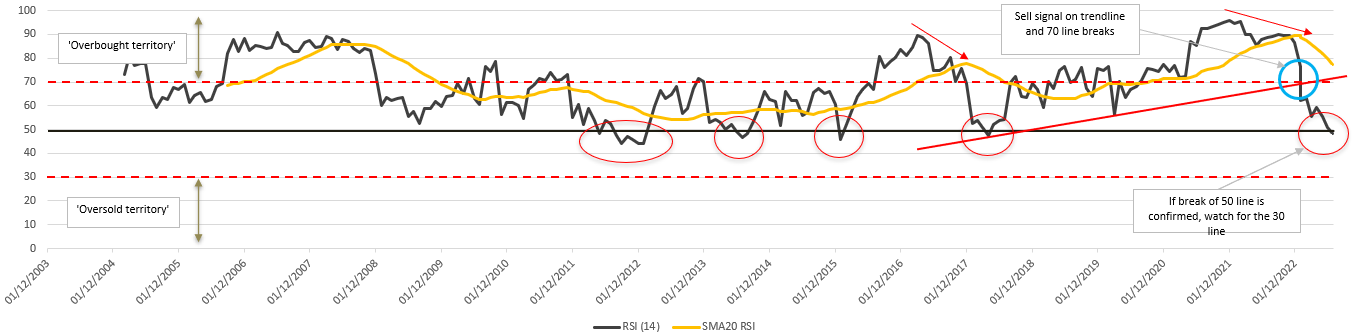
As shown in the chart above, in August 2020, the index’s Relative Strength Index (RSI) broke above the ’70 line’, which is usually taken to signal that the index is overbought. The price then accelerated upwards.
That momentum exhausted itself in the spring of 2022, which resulted in the divergence between the index and its RSI, an indicator of a bearish market. Proponents of technical analysis consider a bearish divergence when the RSI breaks the ‘70 line’ as a sell signal, which is further reinforced by the index breaking its RSI trendline (in red in Chart 2).
The price of the Dom Pérignon index is now retracing to its 50-month Simple Moving Average (in blue in Chart 1). The following support levels should be monitored to determine whether the index is merely undergoing a price correction, or whether its long-term trend is invalidated:
a) the lower Bollinger Band (in grey in Chart 1), which is beginning to flatten at 532.19,
b) the SMA50,
c) the ascending trendline around 485.
Should any of these support levels be breached, they would be further indication that the Dom Pérignon index is bucking its long-term bullish trend.
However, considering Champagne has been relatively active amid the current market downturn and the fact that the region is likely to be buoyed by Christmas demand, there is hope yet for prices to rebound.
There are currently 154 LIVE bids and offers on Dom Pérignon on Liv-ex. Log in to the exchange to view them and trade.
In case you missed it
Here’s what we’ve been reading:
- Liv-ex: Craggy Range Le Sol Syrah and Aroha Pinot Noir 2021 released
- Decanter: Italian & Spanish wine harvests 2023: Crops to plunge to six-year lows
- Financial Times: Central banks must keep interest rates high until inflation is tamed, says OECD
Liv-ex analysis is drawn from the world’s most comprehensive database of fine wine prices. The data reflects the real-time activity of Liv-ex’s 620+ merchant members from across the globe. Together they represent the largest pool of liquidity in the world – currently £100m of bids and offers across 20,000 wines.