
April 2023 Market Report
Share this article | Print this article
- The industry benchmark Liv-ex 100 index rose for the second month in a row.
- The Rhone 100 was the top performer in March.
- Lisa Perrotti-Brown MW’s top-scoring Dominus vintages.
- Ornellaia and Masseto’s secondary market performance – Axel Heinz’ departure.
- Technical Analysis of the Rhone 100 index confirms a long-term bullish trend.
- Final Thought – Finding value in Pomerol.
Momentum returns to the fine wine market

After a slow start to the year, the secondary market is beginning to find its feet, albeit tentatively. Trade was up by both value and volume this month, adding to February’s improvements. The market also broadened as 2,245 different wine labels (LWIN11s) traded – the highest monthly amount year-to-date.
With the increased variety of wines trading, Bordeaux’s trade (by value) fell slightly from 38.5% last month to 36.2%. Champagne also fell slightly from 14.2% to 13.7%. Meanwhile, Burgundy and California both increased their trade shares, accounting for 22.8% and 8.7% respectively.
The industry benchmark Liv-ex 100 index rose for the second month in a row (0.2%), while the broadest measure of the market, the Liv-ex 1000 index, ran flat (0.0%).
Several of the Liv-ex 1000’s sub-indices were up this month, although not all rose enough to recover their February losses. The Champagne 50 suffered the biggest decline, down 1.1%. It was followed by the Rest of the World 60, which fell 0.2%. The Rhone 100 was the biggest riser, up 0.3%. Later in this report, we ponder its future direction using technical analysis.
First Growth’s prices fell for the second month in a row, down 0.2%. Three vintages from Chateau Latour were among the biggest fallers. The 2010 was down 3.6%, while the 2013 and 2009 fell 3.4% and 2.7% respectively.
Major Market Movers – Rhone on the rise
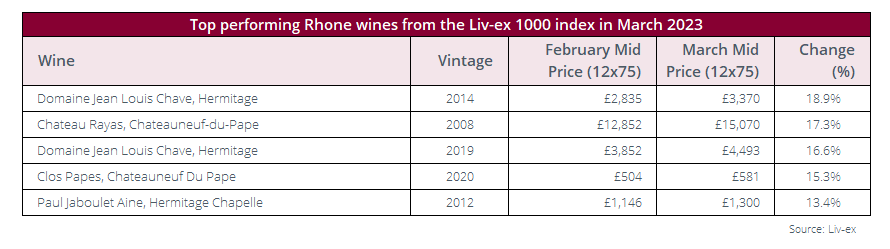
The Rhone 100 index was the biggest riser among the Liv-ex 1000 sub-indices this month. Although the index was only up 0.3%, several of its component wines made significant improvements.
Two vintages of Domaine Jean Louis Chave Hermitage were among the biggest risers: the 2014 and 2019 rose 18.9% and 15.3% respectively. Joe Czerwinski (Wine Advocate) awarded the 2019 a barrel range of 97-100 points. In his tasting note, he said that ‘comparisons with 2003 aren’t unreasonable’. Fellow Hermitage wine, Paul Jaboulet Aine Chapelle 2012, was also up 13.4%.
Prices shown are Liv-ex Mid Prices, which represents the mid-point between the highest live bid and lowest live offer on the market, validated against additional data including transaction prices. Mid-prices are used to calculate the Liv-ex indices and value the world’s leading fine wine funds. Prices given are for 12x75cl trades, or 6x75cl converted to a 12x75cl price.
Chart of the Month
Technical Analysis of the Rhone 100 index
What is technical analysis?
Technical analysis is a method of analysing and predicting stock movements based on past market data, primarily price and volume. The idea is that past trading activity and prices changes of an ‘asset’ can be valuable indicators of its future price movements.
Our analysis found that despite the recent dip in the Rhone 100 index, it continues to maintain a bullish long-term trend. However, there are some indicators that, if validated in the months ahead, could point to a change of direction.
(Please note that the below section is quite a long and detailed read).
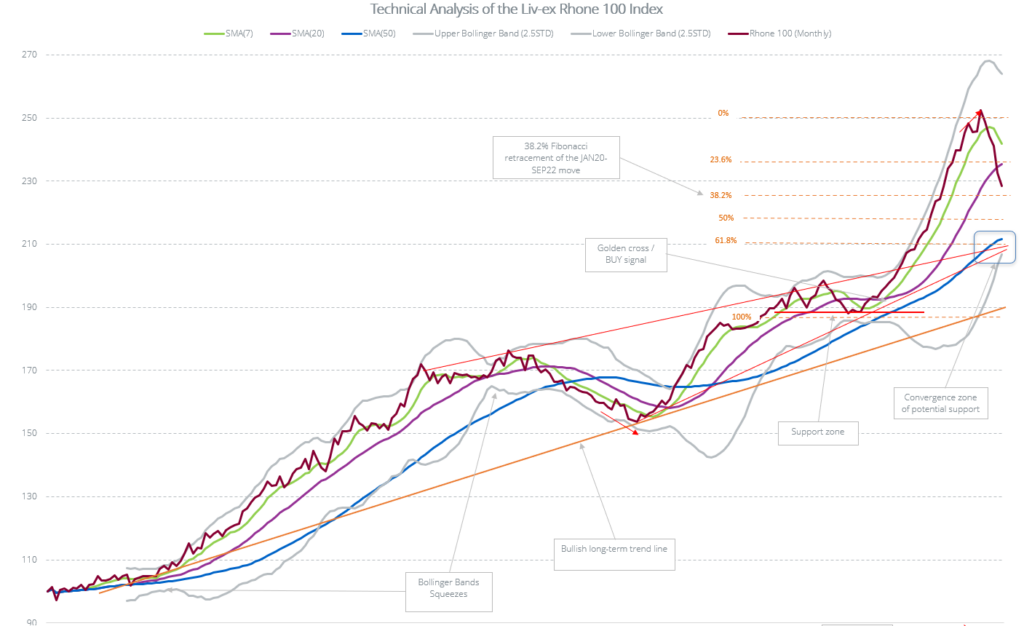
Bullish long-term trend maintained
The Rhone 100 index is making higher highs and higher lows confirming the bullish long-term trend. However, the chart shows more pronounced peaks and troughs than some of the other Liv-ex indices, including declines of around 10% in both 2015 and in 2022-23.
In addition to the long-term bullish trendline (in orange/brown), prices had been moving within a rising wedge pattern (even if not the cleanest) from the end of 2012 until February 2021 when they broke out and accelerated to the upside. The acceleration is confirmed by the widening of the Bollinger Bands (BB) indicating increasing volatility, with the price moving away from its Simple Moving Averages (SMA), and by the Relative Strength Index (RSI) moving back into overbought territory above the ’70 line’.
Momentum telling a different story?
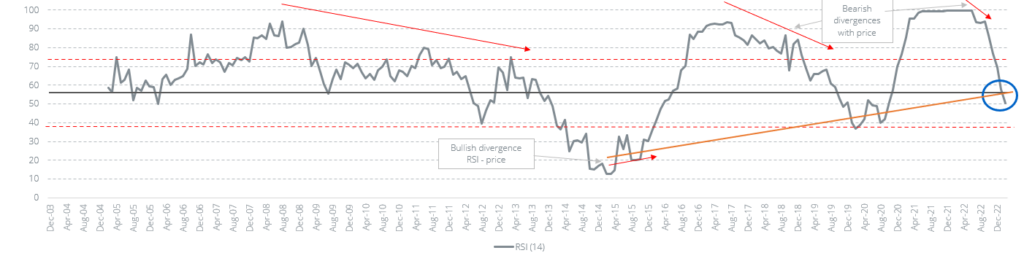
It is noteworthy that the RSI has diverged from the price action almost half of the time over the life of the index. This does not necessarily present trading opportunities since the RSI remains above 50 most of the time (i.e. ‘long’ territory), but it tells us that the velocity of directional movements has not been as strong as price would imply, particularly until 2015.
In 2015, the RSI dropped to 12, which is the lowest read we have seen so far on a Liv-ex index. From these lows, price and RSI diverged once again, but this time in a bullish manner leading to the resumption and acceleration of the long-term trend. Since 2015, RSI has not once returned into oversold territory (below the ’30 line’).
Major support around 190
Towards the end of 2018, price started to consolidate around 190, a level that served as support twice before being broken, then re-tested, and finally broken back to make a new high in December 2020. The new high was accompanied by a golden cross of the fast SMA (SMA7) with the slower SMA (SMA20) and with RSI breaking back into the acceleration zone over 70. Based on technical analysis, December 2020 or January 2021 would have been valid points of entry for buying or adding to ’long’ positions in the Index.
What now?
The last upward phase from the lows of January 2020 has evidently been quite extended: price flirting with the upper BB at a very steep angle, separation of price from its respective SMAs, RSI at maximum overbought levels, and a bearish divergence.
These all pointed towards a possible retracement of the trend, which is still ongoing. Price has almost reached the 38.2% Fibonacci retracement of the entire move up from January 2020. We note that this is a deeper retracement level than what we have seen in the Burgundy or Champagne indexes charts recently. It is possible that the 38.2% level offers some support. Moreover, the RSI hit the ’50 line’ in February 2023 and converged with the rising RSI trendline from 2015, which could also point to a pause in the current decline of the index, should it hold.
Bullish long-term trend maintained in spite of recent weakness
Over the past six months, the index has broken through its SMA7 and its SMA20. If it bounces off the 38.2% level, we would look for a re-test of the SMA20. We will monitor the interaction of the SMA7 and SMA20 in the next few months to see if they cross or not. Should the decline continue, a significant support zone can be found around 211 where the SMA50 converges with the top of the (former) wedge pattern / trendline and the 61.8% Fibonacci retracement.
Invalidation of the bullish strategy
If the Rhone 100’s bullish momentum were to end (i.e. an invalidation), one should look for the following warning signs: 1) The abrupt price decline were to continue: the SMA50 would then likely rise quickly to the 50% Fibonacci level and be vulnerable to a break; 2) a break of the support zone identified around 211. If this were to happen, it would put the long-term bullish trend since inception into question.
The above technical analysis was conducted before the March numbers for the Rhone 100 were calculated.
Critical Corner
Lisa Perrotti-Brown MW’s top-scoring Dominus
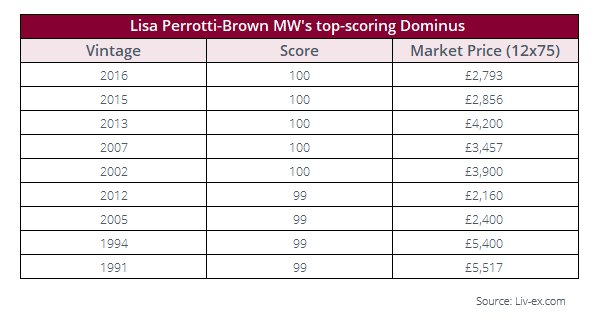
Prices shown are Liv-ex Market Prices. The Market Price is the best listed price for a wine in the secondary market. Unless otherwise stated, it is standardised to 12x75cl. The top-scoring wines was defined as any wine that received 99-100 points from Lisa Perrotti-Brown Mw in the report.
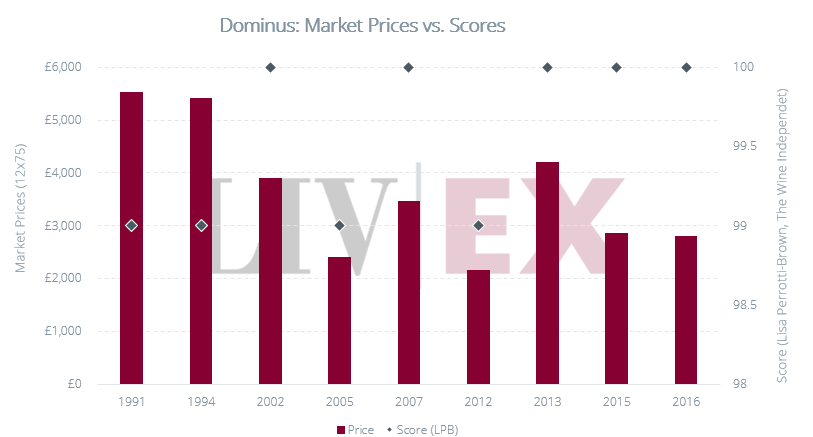
Earlier this month, Lisa Perrotti-Brown MW (The Wine Independent) published an article on Napa Valley’s Dominus Estate. She describes the article as ‘Christian Moueix’s vineyard love story’ and includes reviews of wines from 1991 to the upcoming 2020 release.
The table above shows Perrotti-Brown’s top-scoring wines. Five vintages received 100-points: 2016, 2015, 2013, 2007 and 2002. A further four wines received 99-points: 2012, 2005, 1994 and 1991.
The chart below compares the Market Prices of these top-scoring wines. Interestingly, there is a 50.4% price gap between the most expensive 100-point wine (2013) and the least expensive (2016).
News Insights
Axel Heinz leaves Ornellaia
As reported by Jane Anson (Inside Bordeaux), Axel Heinz, estate director of Ornellaia and Masseto since 2006, is leaving to take up the role of director and CEO of Château Lascombes.
According to the report, Heinz will join Lascombes in time for the 2023 harvest after 18 years in Tuscany.
During Heinz’ tenure, Ornellaia and Masseto have both become prominent names on the secondary fine wine market. By 2022, the two Super Tuscans accounted for 3.7% and 5.7% of Italian trade by value respectively.
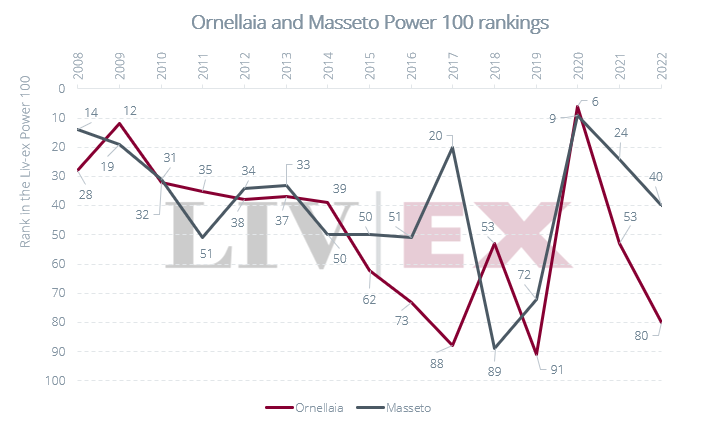
Both wines have featured in the Liv-ex Power 100 – our annual list of the most powerful fine wine brands – every year since its inception in 2008. Their respective rankings each year can be seen in the chart below. Both wines achieved their highest position in 2020, with Ornellaia placing 6th and Masseto in 9th.
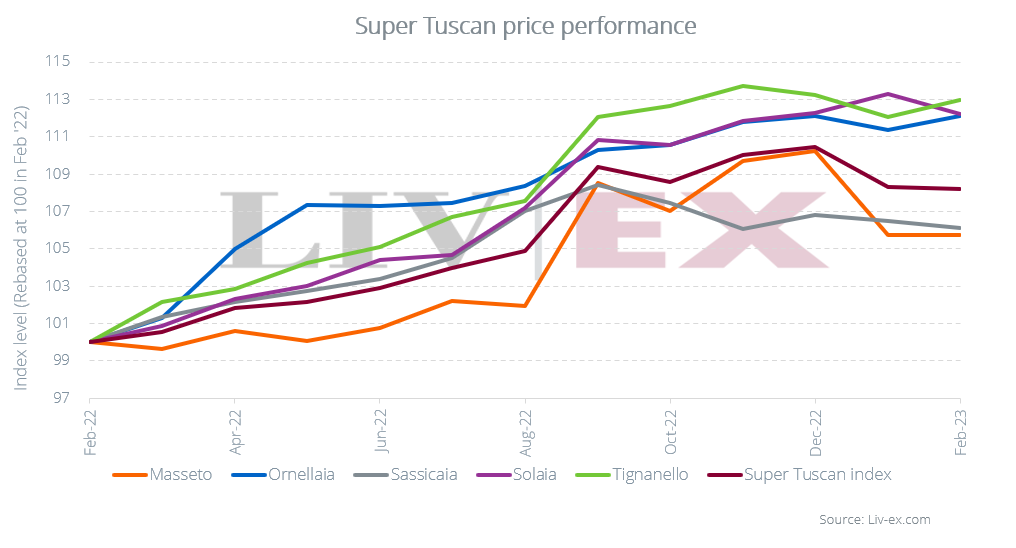
The chart below shows the price performance of the Super Tuscan wines included in the Italy 100 index over the past year. Both estates have had a strong year, with prices rising 5.8% for Masseto and 12.1% for Ornellaia.
Although Masseto has somewhat trailed behind its peers in terms of performance, it does have a far higher average cost. In February 2023, one would buy a case of Masseto for £7,198 on average* compared to £1,802 for a case of Ornellaia. The average Mid-Price for Tignanello (the top price performer) was £1,430 per 12×75.
*based off the Mid-Prices for the past ten physical vintages.
*The Super Tuscan Indices are calculated using the Liv-ex Mid Price. The Mid-Price is the mid-point between the highest live bid and lowest live offer on the market, validated against additional data including transaction prices. Mid-prices are used to calculate the Liv-ex indices and value the world’s leading fine wine funds. Prices given are for 12x75cl trades, or 6x75cl converted to a 12x75cl price.
Final Thought
Finding value in Pomerol
Pomerol has been a long-term staple of the fine wine market and features among many wine collectors cellars. As demand has driven prices to new highs, the question of value – and where to find it – has never been more pertinent. Today we review some of the highest scoring wines from the region and investigate which estates might offer relative value for money.
Recent critic scores
Pomerol has been in the spotlight this month after several wines received 100-points in recent critic reports. Of the 461 Pomerol wines we analysed, 34 have received 100-points from at least one critic. Chateau Lafleur received the most praise, with nine of its wines receiving a perfect score. It was followed by Petrus and Le Pin.
With a 100-points from four different critics, Petrus 2018 and Vieux Chateau Certan 2016 are the most admired. However, with Market Prices of £44,336 and £3,500 respectively, there is a significant price gap between the two wines.
For those looking for critical perfection at even lower price points, several vintages of L’Eglise-Clinet, L’Evangile, Trotanoy and Vieux Chateau Certain received 100-points and are available for less than £3,500 a case.
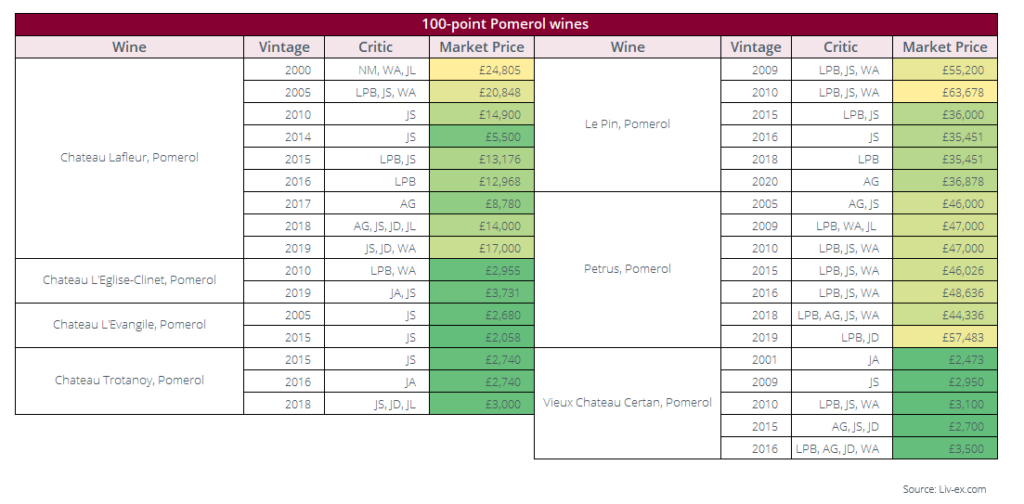
The critics shown in the table above include: Neal Martin (NM), Wine Advocate (WA), Jeff Leve (JL), Lisa Perrotti-Brown MW (LPB), James Suckling (JS), Antonio Galloni (AG), Jeb Dunnuck (JD), and Jane Anson (JA). Prices shown are Liv-ex Market Prices. The Market Price is the best listed price for a wine in the secondary market. Unless otherwise stated, it is standardised to 12x75cl.
POP scores
Another way of assessing the relative value of an estate is by its POP score – its price-over-points ratio, our loose measure of value.
It is calculated by dividing the price of a nine-litre case of wine by a shortened 20-point score (in this instance from Neal Martin, Liv-ex members Bordeaux critic of choice). We have calculated this 20-point score by simply subtracting 80 from the official rating (for barrel-score spreads we use the mid-point of the score), on the basis that any wine under 80 points is unlikely to attract a secondary market. In theory, the lower the POP score the better value a wine is.
As the table below shows, with an average Market Price of £671 and average Neal Martin score of 93.2, Chateau Gazin has the lowest POP score of 50.9, indicating that it offers the best value for money. It is followed by Chateau Clinet and Chateau La Conseillante.
Perhaps unsurprisingly, the three estates found in the Right Bank 50 index feature at the bottom of the list – these wines have significantly higher Market Prices on average.
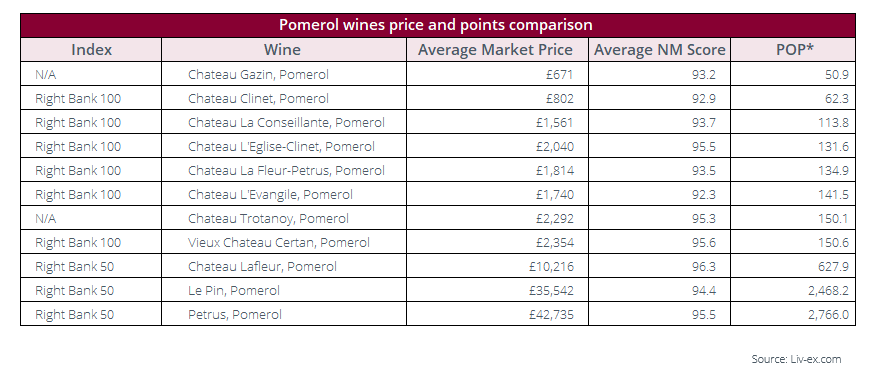
*A wine’s POP score is its price-over-points ratio, our loose measure of value. It is calculated by dividing the price of a nine-litre case of wine by a shortened 20-point score (in this instance from Neal Martin, Liv-ex members Bordeaux critic of choice). We have calculated this 20-point score by simply subtracting 80 from the official rating (for barrel-score spreads we use the mid-point of the score), on the basis that any wine under 80 points is unlikely to attract a secondary market. In theory, the lower the POP score the better value a wine is. We looked at the 2010-2020 vintages of the all the wines. From this, we calculated the average Market Price and average Neal Martin score. The latest Neal Martin score was used (from Vinous and Wine Advocate). Prices shown are Liv-ex Market Prices. The Market Price is the best listed price for a wine in the secondary market. Unless otherwise stated, it is standardised to 12x75cl
Price performance
In terms of price performance, Le Pin has been the best-performing Pomerol wine (of those included in the Liv-ex indices) over the past year. On average its price has risen 15.5%. It was followed by La Conseillante and Petrus, which were up 9.2% and 9.0% respectively.
Some of the top-performing wines from these estates included Le Pin 2011 (+32.2%) and 2010 (+17.3%), Petrus 2016 (+22.5%) and 2015 (+16.9%), along with La Conseillante 2014 (+24.0%) and 2016 (+16.7%).
Meanwhile, L’Eglise Clinet finished the year in negative territory, down 3.2%. Its 2014 and 2018 vintages were among the biggest fallers, down 6.9% and 6.4% respectively. Unsurprisingly perhaps, as the table above shows, the estate has one of the lowest POP scores amongst the leading Pomerols.
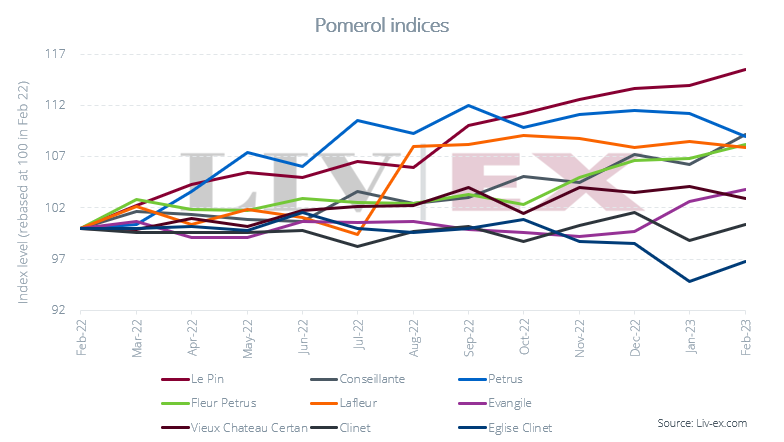
The indices show the Mid-Price movements of the past ten physical vintages of the Pomerol wines found in the Liv-ex Bordeaux 500 index. The Mid-Price is the mid-point between the highest live bid and lowest live offer on the market, validated against additional data including transaction prices. Mid-prices are used to calculate the Liv-ex indices and value the world’s leading fine wine funds. Prices given are for 12x75cl trades, or 6x75cl converted to a 12x75cl price.
Fair value
Using Liv-ex’s ‘Fair Value’ methodology, Pomerol wines are 84% correlated to Neal Martin scores (Vinous and Wine Advocate). Several vintages fall below the ‘Fair Value’ line, indicating that these wines might offer relative value and therefore, good returns on investment.
The standout, with an average Market Price of £2,364, is the 2014 vintage which lies the furthest below the Fair Value line.
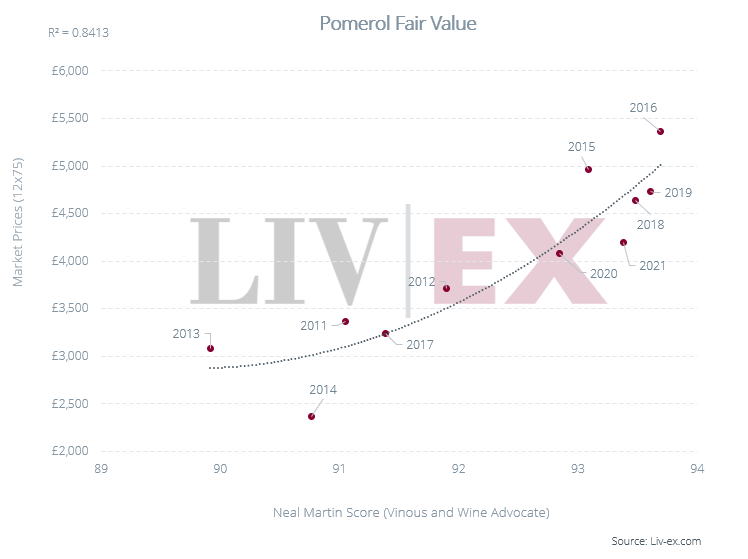
The chart above shows the average Market Price and Neal Martin scores (Vinous and Wine Advocate) for 57 Pomerol wines. Prices shown are Liv-ex Market Prices. The Market Price is the best listed price for a wine in the secondary market. Unless otherwise stated, it is standardised to 12x75cl.
Conclusion
There are still many wines offering relative value in the elite fine wine region of Pomerol. When considering Neal Martin scores, Gazin, Clinet and La Conseillante are the standout winners, with the lowest POP scores. Conseillante has also seen the second-best returns (on average) over the past year.
For those looking for more specific vintages offering value, 2014 is worth investigating. Although the recent 2020, 2019 and 2018 vintages also look attractive. Furthermore, several 100-point wines from the region are available at significant discounts compared to their 100-point peers.
Liv-ex analysis is drawn from the world’s most comprehensive database of fine wine prices. The data reflects the real time activity of Liv-ex’s 620 merchant members from across the globe. Together they represent the largest pool of liquidity in the world – currently £80m of bids and offers across 16,000 wines.