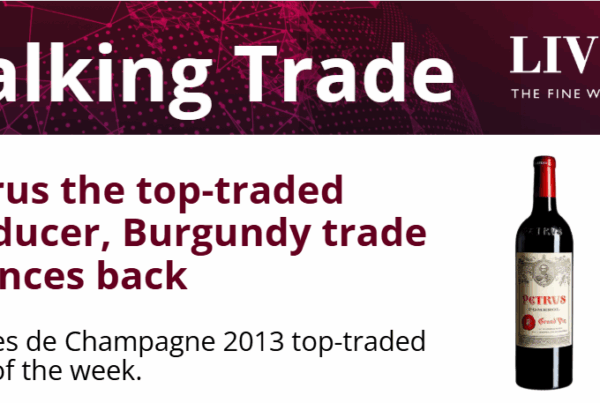
Burgundy trade increased in the second week of the month, even as three Bordeaux labels topped sales by value.
- Burgundy trade saw the biggest increase over the last week.
- Mouton-Rothschild’s 2015 vintage returned to its 2018 high.
- The October Market Report was published this week.
A recap of this week’s Insights
The October Market Report was released this week. The final section focused on the recent review of the 2017 Bordeaux vintage.
Not a classic of the post-2010 vintages, there are nonetheless good wines to be found among its ranks. Though an inspection of average scores and prices suggests that the 2014s might provide even more enticing opportunities for those after stocks of ‘drinking claret’.
Staying fixed on Bordeaux, we also dived back into the question of Lafite’s premium versus its fellow First Growths.
From a high of 129% in 2010, the price premium for Lafite ebbed to 24% in 2017. So far this year it appears to be climbing once again and is back at 34%.
A breakdown of this week’s trade by region
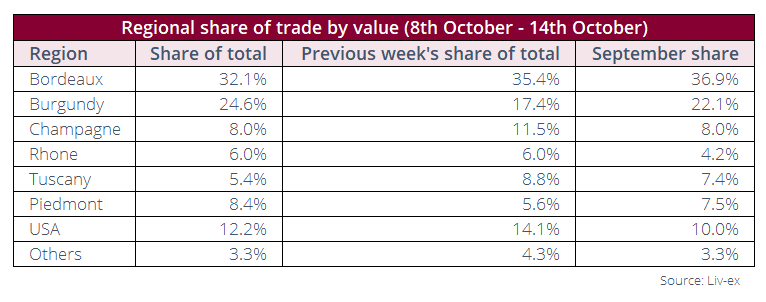
Bordeaux maintained a slight grip on regional market share over the last week, with Burgundy growing its share from the start of the month.
Burgundy has so far accounted for 20% of trade this year, with the 2018, 2017, 2015 and 2016 vintages taking the majority of trade respectively.
The other main regions didn’t see any wild swings this week. Tuscany, the US and Champagne declined slightly from the week before, while Piedmont’s share rose and the Rhône remained the same.
Most traded wines
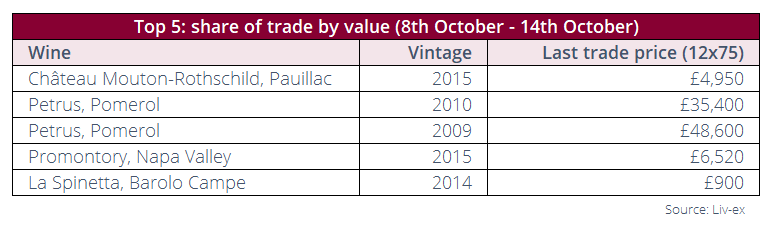
Château Mouton-Rothschild’s 2015 vintage led trade this week. The wine is back at a Market Price of £4,950, which was its peak at the end of September 2018. It has risen 19% in price since its release.
The 2009 and 2010 Petrus – both with 100-point scores from Robert Parker – were also at the forefront of trade.
The Petrus 2009 is the best-performer of the three year-to-date, up 10.4%. The 2010 is up 7.8% and the Mouton 9.3%.
The chart below shows the price performance of the three over the past five years.
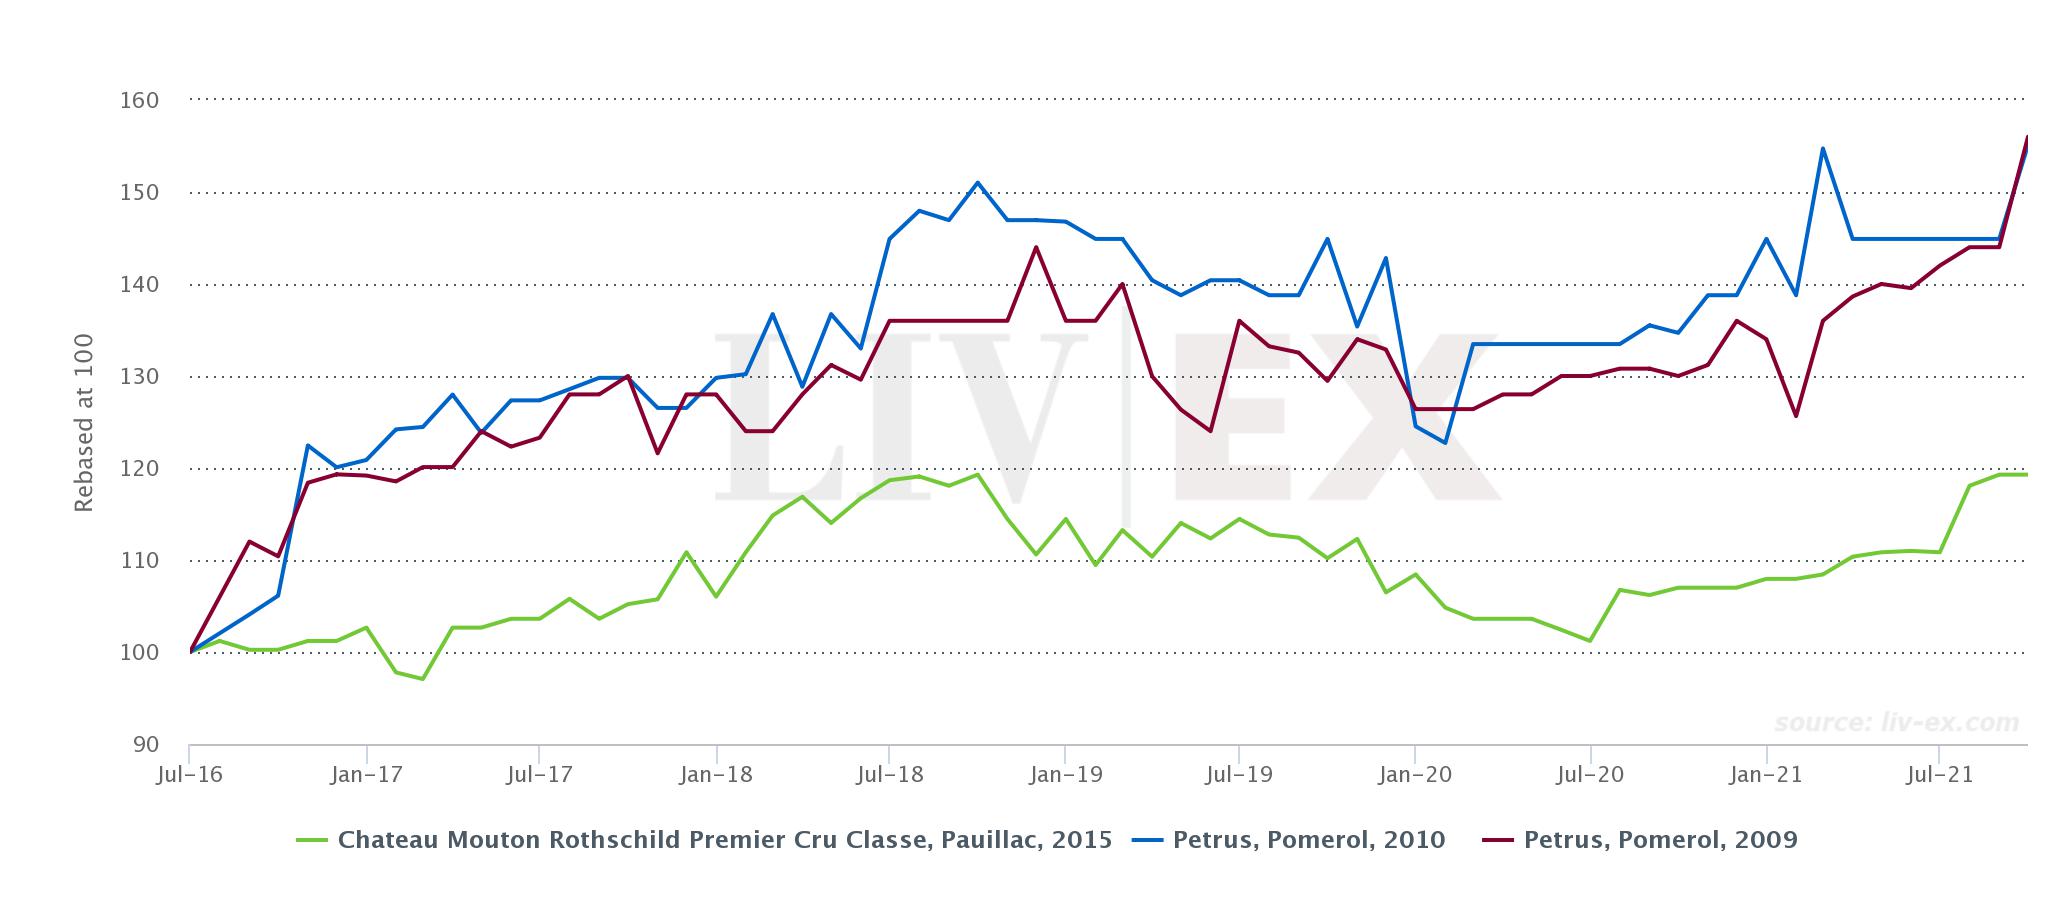
*made with the Liv-ex Charting Tool
Members of Liv-ex can explore the new charting tool here.
Non-members of Liv-ex can learn more and request a demo here.
Liv-ex analysis is drawn from the world’s most comprehensive database of fine wine prices. The data reflects the real time activity of Liv-ex’s 550+ merchant members from across the globe. Together they represent the largest pool of liquidity in the world – currently £90m of bids and offers across 20,000 wine markets. Independent data, direct from the market.