- The Liv-ex Fine Wine 1000 fell 0.6% in November.
- The Champagne 50 was the worst-performing sub-index, down 2.5%.
- The Italy 100 was the only sub-index to rise, up 0.6%.
*made using the Liv-ex Charting Tool.
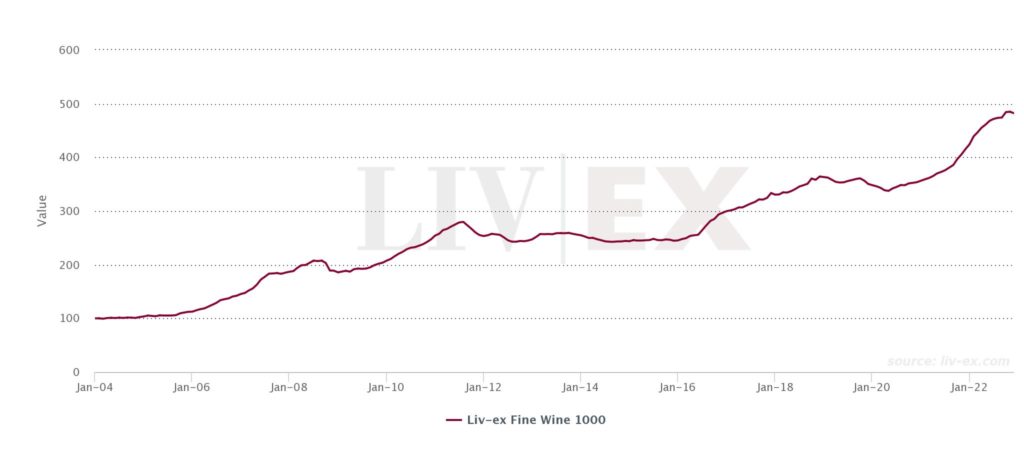
The broadest measure of the secondary market, Liv-ex Fine Wine 1000 index, dipped 0.6% in November, closing the month at 482.15.
It performed slightly worse than the benchmark Liv-ex Fine Wine 100, which fell 0.4% last month as Sterling strengthened further against the Dollar. The Liv-ex Fine Wine 50 was also down 1.1%.
Among the Liv-ex 1000 sub-indices, all bar one declined in November, including a serious reverse for the Champagne 50.
Champagne 50 falls 2.5%

*made using the Liv-ex Charting Tool.

After five months as the best-performing sub-index, the Champagne 50 took a tumble last month, with prices declining 2.5%.
It was the first negative performance for the sub-index since April. However, back then the index dipped just 0.2%.
This month’s steeper decline was perhaps inevitable after a year of gains and record levels of demand. In the Champagne report published in September, it was noted that sustaining its recent gains was going to be a challenge.
However, the Champagne 50 was not alone in experiencing a decline in November. All of the seven indices except one, the Italy 100, fell last month or ran flat in the case of the Bordeaux 500.
The Italy 100 was kept up by some positive performances from Soldera Case Basse 2009 (up 22.8%) along with Masseto 2013 and 2015 (up 13.9% and 12.8% respectively).
What is the Liv-ex 1000 index?
The Liv-ex Fine Wine 1000 Index is broadest measure of the market. It represents the price movement of 1000 of the most sought-after fine wines on the world’s most active and liquid marketplace. Stretching back over 20 years, the Liv-ex 1000 is comprised of seven sub-indices from across the world: the Bordeaux 500, the Bordeaux Legends 40, the Burgundy 150, the Champagne 50, the Rhone 100, the Italy 100 and the Rest of the World 60.
All Liv-ex indices are calculated using our Mid Price; the mid-point between the highest live bid and lowest live offer on the market. These are the firm commitments to buy and sell at that price; transactional data rather than list prices. It represents the actual trading activity of 600 of the world’s leading fine wine merchants. Because Liv-ex doesn’t itself trade, this data is truly independent and reliable.
Not a member of Liv-ex? Request a demo to see the exchange and a member of our team will be in touch with you shortly.
Liv-ex analysis is drawn from the world’s most comprehensive database of fine wine prices. The data reflects the real time activity of Liv-ex’s 600 merchant members from across the globe. Together they represent the largest pool of liquidity in the world – currently £80m of bids and offers across 16,000 wines. Independent data, direct from the market.