Print and read offline.
Introduction
History does not repeat but it often rhymes. As the second quarter of the year progressed, headlines have increasingly echoed the 1970s, with a fuel crisis, the resulting inflation (or worse, stagflation), widespread strikes and a conflict involving the world’s superpowers, dominating the news.
The world’s economic woes have continued to deepen from the first quarter to the second, reflected in bond and equity markets (some of which have entered bear markets) but the fine wine market has managed to keep its head – for now.
In the Q1 report it was noted that the leading fine wine indices, the Liv-ex Fine Wine 100 and Fine Wine 1000, had seen their gains begin to slow after their flourish in late 2021 and January of this year.
Both indices have continued to rise over the past quarter, but at a more subdued pace seen since February. Of the two, the Liv-ex 1000 saw stronger gains, a little over 1% on average each month, while the Liv-ex 100 has now risen 0.7% for four consecutive months.
The slower rise of the Liv-ex 100 suggests that in increasingly straitened circumstances buyers are easing off the top blue-chip labels (which the index represents) and falling back instead on the opportunities presented by the much broader pool of wines in the Liv-ex 1000.
Even here though, all the sub-indices showed much more subdued performances than they did in Q1.
The bid to offer ratio – a useful indicator of market sentiment – has dipped from 1.8 to 0.8 from January to June. This is still positive (history tells us that the market can hold its level at a ratio above 0.5) but as offers have continued to build and as buyers have become harder to find, spreads have begun to widen suggesting increased caution as we slip into the summer months
Recession fears hit markets
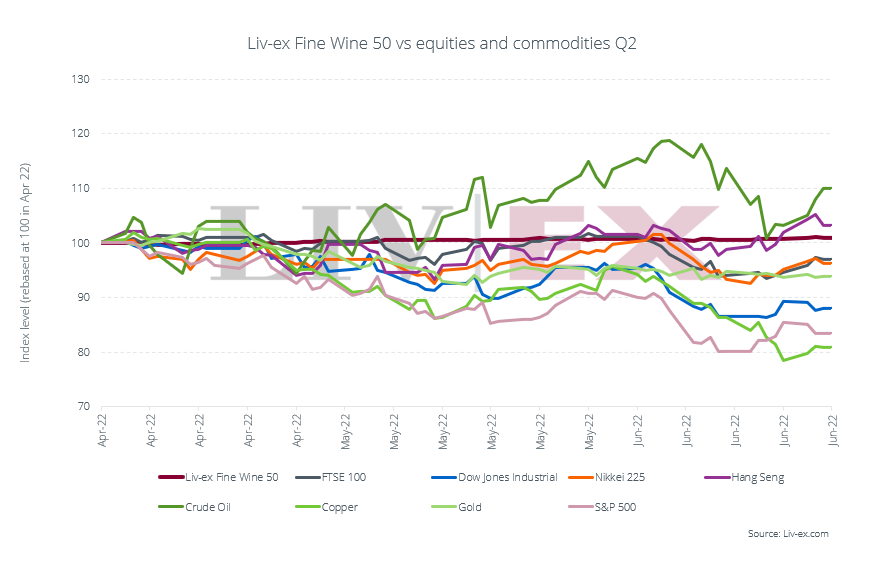
Fears of recession, stagflation and rising interest rates led to a rocky period for equities and commodities alike in Q2.
Copper, regarded by many as a bellwether for the global economy, had a particularly tough quarter, falling 20%. US equities, including the DOW Jones and S&P 500, dipped into bear market territory after the Federal Reserve Board’s rate hike (see more below).
The Liv-ex Fine Wine 50 continued to hold firm, though it rose just 1% quarter-on-quarter. It out-performed major equities and commodities except for crude oil which remains high due to the war in Ukraine and the Hang Seng which bounced back from a Q1 dip after Shanghai began to unlock and cross border quarantine rules were relaxed.
The Fed turns off the money taps
In mid-June, the Federal Reserve Board (the ‘Fed’) raised interest rates by 0.75 percentage points (the biggest hike since 1994) in a bid to combat inflation.
This sea change followed more than two decades of low interest rates combined with broad based quantative easing, massively raising the money supply in a bid to maintain economic activity through various wobbles.
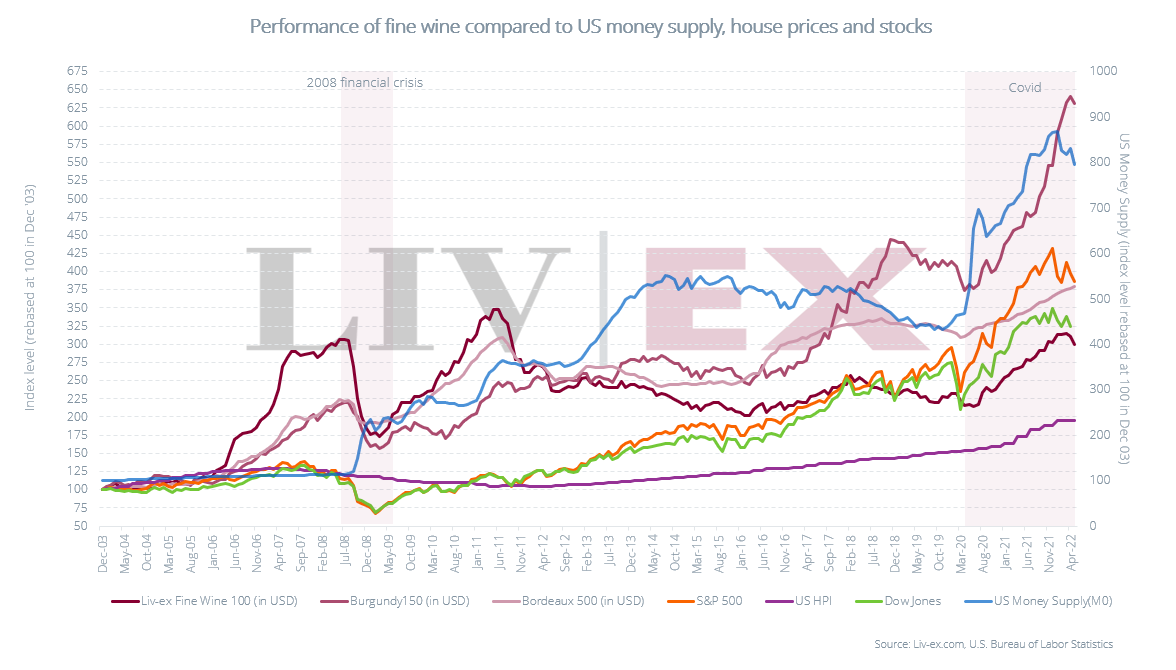
As the chart below shows, during the three notable post-2000 crises – the 2008 crash, the 2012 Euro crisis and 2020 pandemic – the Federal Reserve pumped vast amounts of money (M0) into the system.
The number of US Dollars currently in circulation is double what it was a decade ago. This access to cheap money during the pandemic provided a fillip for a broad range of assets including property, commodities, equities, and fine wine. As was noted in 2021’s end of year review, this was a key driver of the secondary market’s storming success in late 2020 and throughout 2021.
However, in aggressively raising interest rates to slow inflation, we have seen increased turbulence in global financial markets (particularly the US Nasdaq). Measured in Sterling fine wine indices such as the Liv-ex 100 and Burgundy 150 have not flinched, but viewed through the lens of the US Dollar, one can see a turning point may have been reached.
Liv-ex 1000 sub-indices see smaller gains
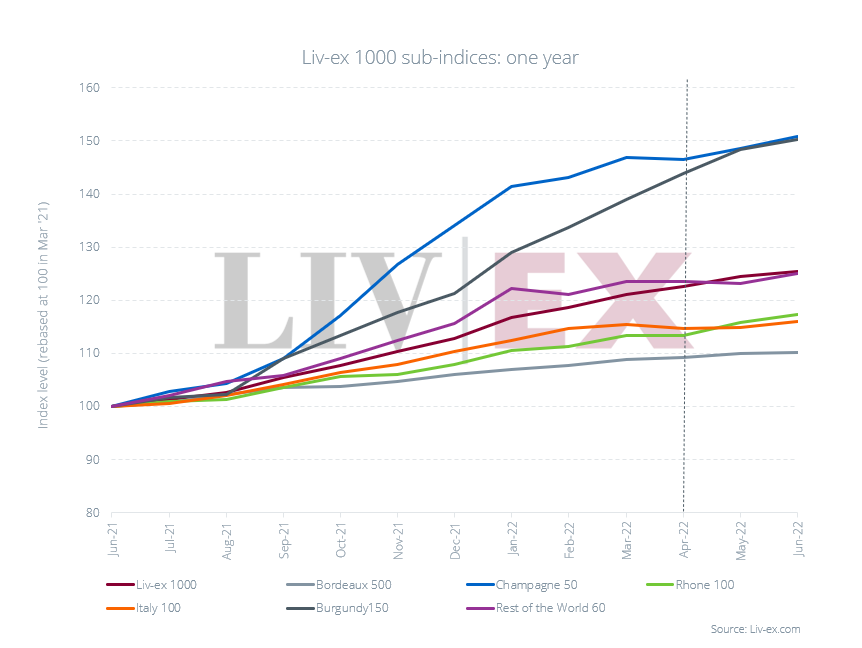
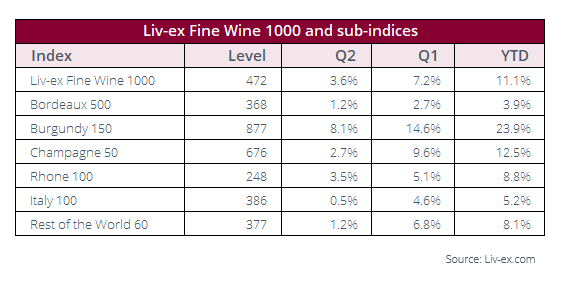
Denominated in Sterling, the Liv-ex Fine Wine 1000 rose 4% in the last quarter and is up 11.1% year-to-date. Once again, the chief driver of the index in Q2 was the Burgundy 150, which rose 8%
The Rhone 100 was the next strongest sub-index over the last three months, up 4%. The Champagne 50 meanwhile was also less strident than it had been in the first quarter, rising 3%.
As the table below shows, all the Liv-ex 1000 sub-indices rose far less than they did in Q1.
Rhône and Burgundy labels top price performance
Unlike Q1 where the top price performers were all Burgundy labels bar one, in Q2 there was more of a mix.
Rhône wine Ermitage Le Pavillon from Chapoutier was the standout performer, one of three Rhône labels alongside Jean Louis Chave’s Hermitage 2015. The 2011 vintage of the same wine was one of the best performers in Q1.
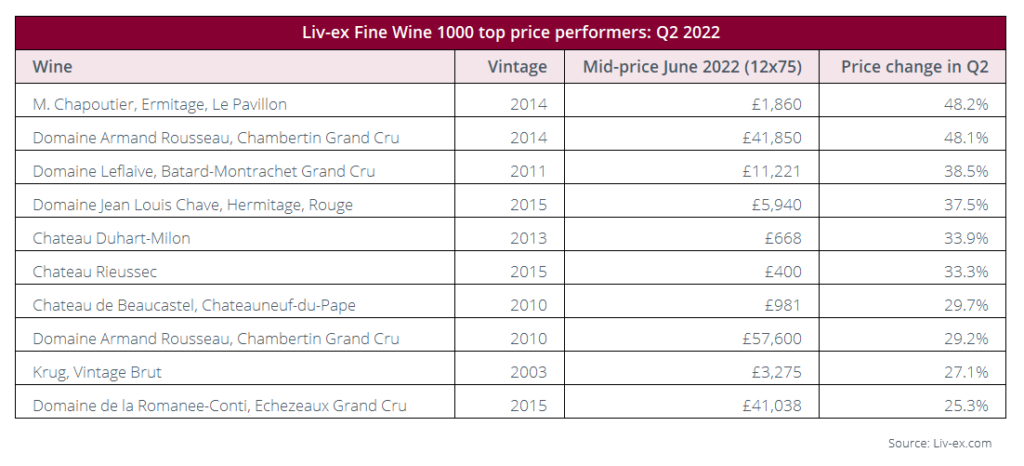 The prices shown in the table above are Liv-ex Mid-Prices. The Mid-Price is the mid-point between the highest live bid and lowest live offer on the market. These are the firm commitments to buy and sell at that price; transactional data rather than list prices. It represents the actual trading activity of 600 of the world’s leading fine wine merchants. Because Liv-ex does not itself trade, this data is truly independent and reliable. Prices given are for 12x75cl trades, or 6x75cl converted to a 12x75cl price.
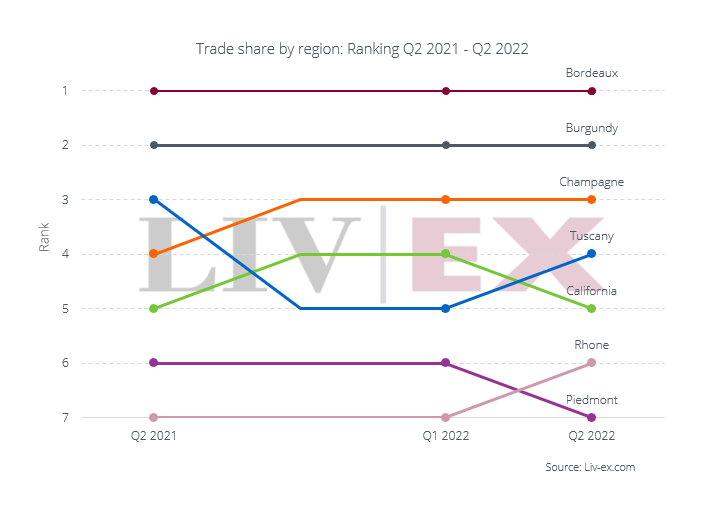
Trading overview in Q2
The months of April to June in the fine wine market are traditionally focused on the new vintage offered by the Bordeaux châteaux. As our post-en primeur report explained, it was a disappointing campaign.
Nonetheless, trade in Bordeaux did rise slightly, from 32.8% of total trade by value in Q1 to 35.1% – though this was driven by trade in older, better value vintages than demand for 2021s.
Most other regions maintained their trade levels from the first quarter to the second. The only exceptions were California and Piedmont which both saw their total trade by value decline. This meant they were overtaken in the rankings by Tuscany and the Rhône respectively, even though both of those regions did not see significant changes in trade.
Top traded wines in Q2
The 2008 vintage of Cristal once again topped the list of most-traded wines by value in Q2. The 2014 vintage also made the list again.
The 2012 vintage of Dom Pérignon remained in high demand and, again, was one of the top traded wines by volume this quarter.
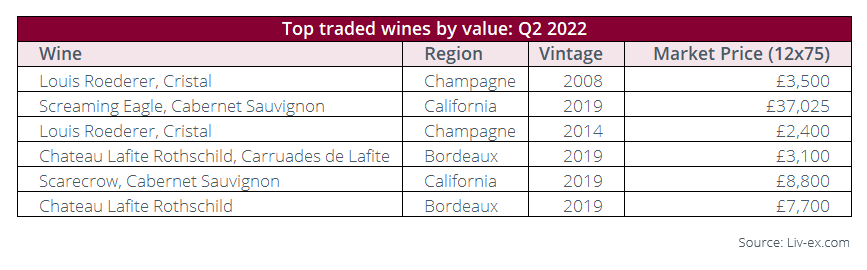
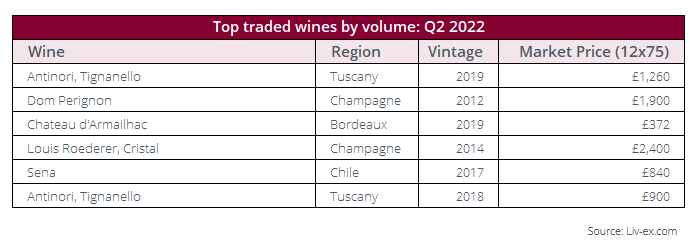 The prices shown in the table above are Liv-ex Market Prices. The Market Price is the best listed price for a wine in the secondary market. It is always presented for a 12×75 case unless otherwise stated. To calculate the Market Price, we look at list prices from a large group of trusted international merchants. Preference is given to prices from stockholders over brokers, to cases over single bottles, and to recent prices over older prices. The algorithm behind it runs every day, evaluating a pool of over 1 billion data points to determine the most accurate Market Prices for 240,000+ wines.
Conclusion
The headwinds for global markets continue to mount. As the on-going war in Ukraine and sanctions against Russia squeeze oil and grain prices, the forecasts for the UK and US economies now suggest recessions in Q3 or Q4. China remains partly closed due to its zero-Covid policy while a nascent recovery in key Asian export markets could yet be scuppered by Dollar strength.
Under such conditions, the previously bullish are likely to turn more bearish as market sentiment wanes. Viewed in Dollars, the fine wine market has already begun to turn down.
But Sterling weakness against the Dollar means fine wine prices are becoming more affordable to American and Asian buyers. Meanwhile collectors of fine wine often view its low correlation to mainstream financial assets as the very reason to hold fast in times such as these, not least as an inflationary hedge.
Furthermore, the fine wine secondary market has shown itself to be much more robust in its current, more diverse form than it was a decade ago, when the secondary market was totally dominated by one region – Bordeaux.
There can be little doubt that the fine wine market has some challenging months ahead of it. But what market doesn’t?
About Liv-ex
Liv-ex analysis is drawn from the world’s most comprehensive database of fine wine prices. The data reflects the real time activity of Liv-ex’s 600 merchant members from across the globe. Together they represent the largest pool of liquidity in the world – currently £100m of bids and offers across 16,000 wines. Independent data, direct from the market.
About the Liv-ex indices
Our indices track the prices of the most traded fine wines on the world’s most active and liquid marketplace; Liv-ex.
They are calculated using our Mid Price; the mid-point between the highest live bid and lowest live offer on the market. These are firm commitments to buy and sell at that price; transactional data rather than list prices. It represents the actual trading activity of 600 of the world’s leading fine wine merchants. Because Liv-ex doesn’t itself trade, this data is truly independent and reliable.
Stretching back over 20 years, the Liv-ex 100 is quoted on Bloomberg and Reuters screens.
Not a member of Liv-ex? Request a demo to see the exchange and a member of our team will be in touch with you shortly.