What’s happening in the market?
Bordeaux 2022s, only recently becoming physical, are beginning to trade more actively. Beychevelle has taken the lead, trading at £700 per 12×75 (16.7% below its ex-London release price) in decent volumes. Carruades is in second place, its purchasing driven largely by Asian buyers.
Today’s deep dive: Jean Louis Chave, Hermitage Rouge
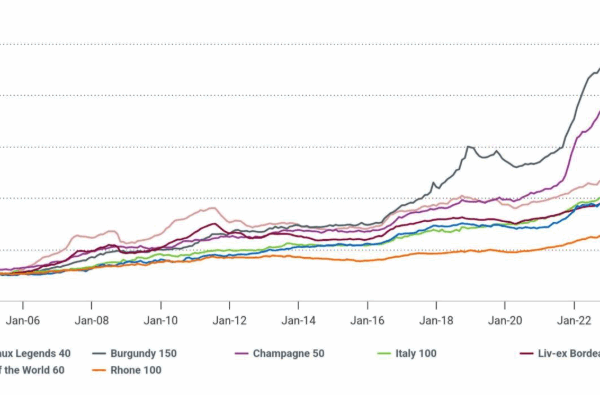
In recent years, the US has risen to be largest export market for Rhône wines, surpassing the UK in 2022. This shift has been mirrored by the secondary market. In 2015, US buyers accounted for 18% of Rhône purchasing on the exchange. Last year, they accounted for over half – in part encouraged by a substantial US marketing campaign launched by Inter Rhône in 2022. The Rhône is amongst the regions that stand to be most greatly impacted by the fallout of Trump tariffs – including current uncertainty.
The impacts of tariff-based uncertainty have already been evident in the swift decline of Rhône bid:offer ratios. Jean Louis Chave, Hermitage Rouge made some promising gains at the start of the year, its bid:offer ratio rising steadily from 0.11 in November 2024 to 0.35 by March 2025. Since tariff announcements, it has dipped, returning gradually over the past two months to a ratio of 0.11. On the bright side for buyers, there is now plenty of Chave Hermitage on offer – 66.0% more (by value) than in March.
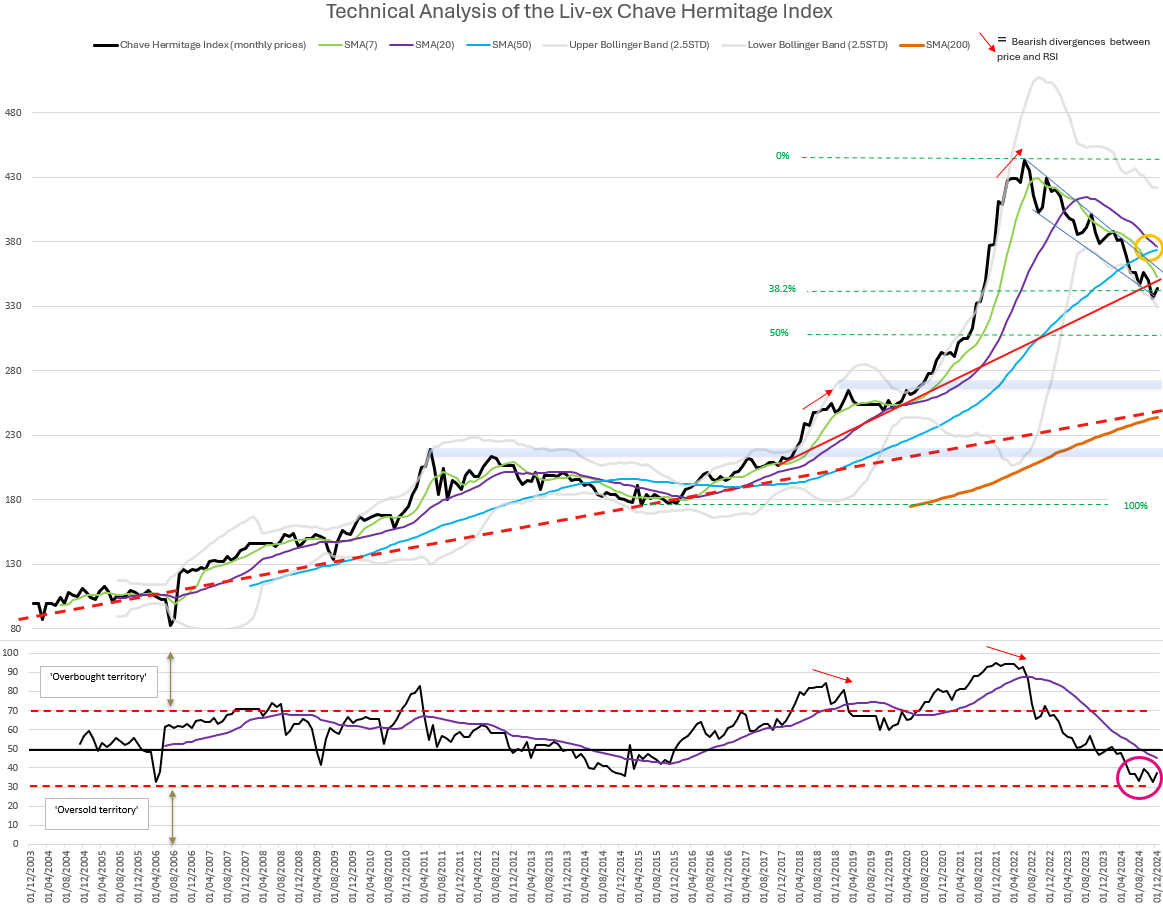
Technical analysis of the Chave Hermitage Index
- Prices of Jean Louis Chave, Hermitage Rouge (currently trading at 344) have been falling within a clear bearish channel since its peak at 470 in late 2022.
- While there appears to be a bullish divergence forming between price and RSI, lower trade volumes in recent months – a consequence of US buyers’ pullback – muddies this signal.
- With little immediate support available for the index, we will have to await a return to regular trade levels for confirmation of a positive shift in momentum.
- Nevertheless, there remain strong opportunities to enter the Chave Hermitage market — particularly those offers close to individual vintages’ horizontal support levels.
Prices – travelling downward
The Chave Hermitage Index is currently trading at 344, falling within a clear bearish channel since peaking near 470 in late 2022. In recent months, the index has broken its medium-term trendline, though the long-term upward trend remains intact.
This marks a significant correction following an extended multi-year uptrend. A further breakdown could target the next support zone at 330, defined by the lower boundary of the channel, and potentially 265, a horizontal price level.
Moving averages confirm the bearish structure. The 20-month Simple Moving Average (SMA20) is close to crossing below the SMA50 (forming a Death Cross), suggesting a potential continuation of downward momentum. The price also remains below the shorter-term SMA7, reinforcing near-term weakness.
The Bollinger Bands (BB) add another layer to this cautious story. After narrowing during the earlier part of the consolidation, they have started to widen again, suggesting that volatility is returning. But crucially, price is hugging the lower band, indicating persistent selling pressure. Until the index can retrace to the SMA20, the path of least resistance remains down.
Momentum – bears losing strength or buyers exiting the market?
At first glance, momentum indicators tell a slightly more positive story than the price index. The Relative Strength Index (RSI) remains in bearish territory, below the neutral 50 level, but has recently formed a double bottom and the beginnings of a bullish divergence (index making lower lows while RSI makes higher lows). Previous bearish divergences between RSI and price (in late 2018 and 2022) were leading indicators of declines from the peaks, which now lend significance to any developing momentum reversal patterns.
We would generally take an RSI reading like this as a weakening of bearish momentum. With the recent exodus of US buyers, however, this could simply be a result of a lack of any momentum. April, May and June combined have seen lower volumes of Chave Hermitage trade than March alone. Without enough participants in this market, sentiment cannot be accurately assessed.
Thus, for confirmation that bearish momentum is abating, we will need to wait for buying to return to regular levels – most likely, until after tariffs have been set in stone.
What’s next for Chave Hermitage?
Technical evidence points to continued weakness for the Chave Hermitage Index in the short-term, but early bottoming momentum signals are emerging. This zone could present a good re-entry point – and there are plenty of opportunities — but caution might be advised until momentum shifts are confirmed by increased trading volumes and the price recaptures its Simple Moving Averages.
Opportunities
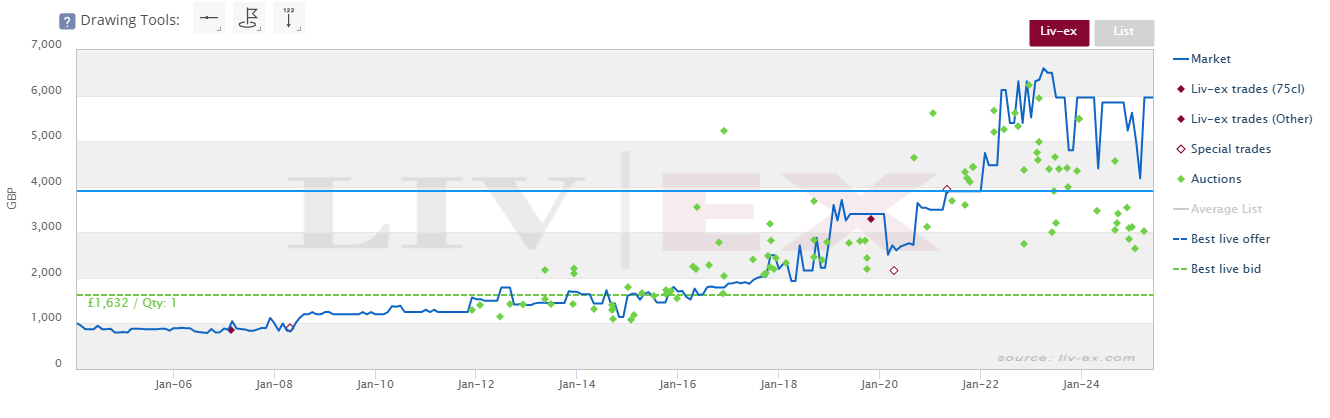
There are several offers of Chave Hermitage below market price (see here). Perhaps more importantly, some of these offers are sitting at 2021 lows or horizontals – the next critical support levels for the broader index. Amongst them are two 3×75 cases of the 2001 at £3,490 per 12×75 (represented by the blue line below).
Liv-ex trades of Jean Louis Chave, Hermitage Rouge 2001
Liv-ex analysis is drawn from the world’s most comprehensive database of fine wine prices. The data reflects the real-time activity of Liv-ex’s 620+ merchant members from across the globe. Together they represent the largest pool of liquidity in the world – currently £140m of bids and offers across 20,000 wines.