May 2025 Market Report
- The fine wine market in April
- The introduction of tariffs, combined with much of the trade heading to Bordeaux for En Primeur tastings and the Easter break, resulted in sharp falls across each major index
- April market activity
- Total trade value fell 30.2% month-on-month, driven by a reduction in trade count, volumes and average transaction value
- Recent US market activity
- With a reduction in tariffs on EU imports to 10% until July, April saw US bid exposure tick back up. We give an update on the current situation
Indices overview
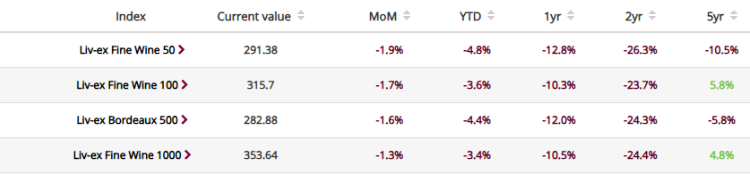
The fine wine market faced strengthening headwinds in April. The industry standard Fine Wine 100 closed down 1.7%, its greatest monthly decline since August 2023.
The wider market, as represented by the Fine Wine 1000, fell 1.3%. The Champagne 50 was the worst-performing sub-index (-2.6%). With US buyers accounting for 47.7% of Champagne trade in the preceding 12 months, the region’s prices appear to have been particularly affected by the introduction of tariffs.
Focusing on Bordeaux, the Fine Wine 50 (which tracks the 10 most recent physical vintages of the First Growths) fell 1.9%. The wider Bordeaux 500 fared slightly better (-1.6%).
Major Liv-ex indices evolution
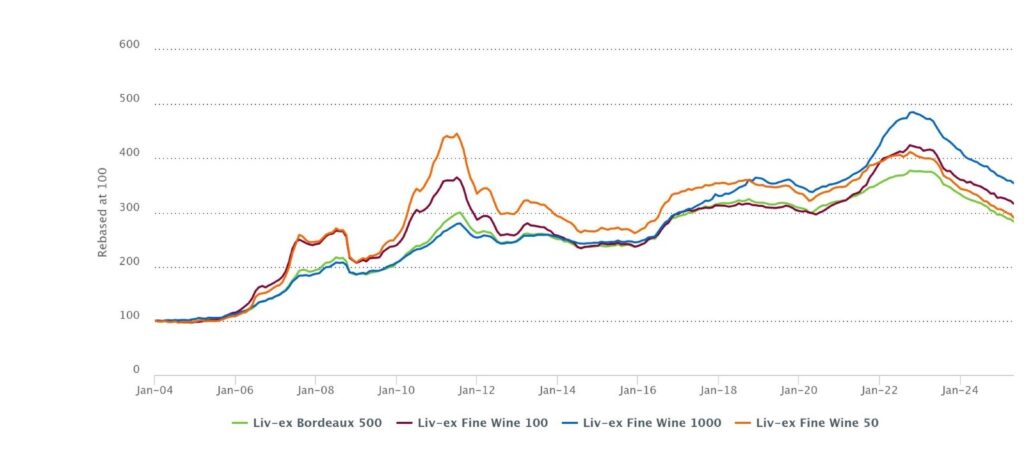
Made using Charting Tool.
The Fine Wine 50 and Bordeaux 500 now sit 9.8% and 5.8% respectively beneath their 2020 lows. Meanwhile the 2024 En Primeur campaign rumbles on with significant and commendable price reductions from producers. However it appears that buyers’ apathy has taken hold, with reports that the campaign’s successes have been few and far between.
For further analysis on April indices, please read this report.
April market activity
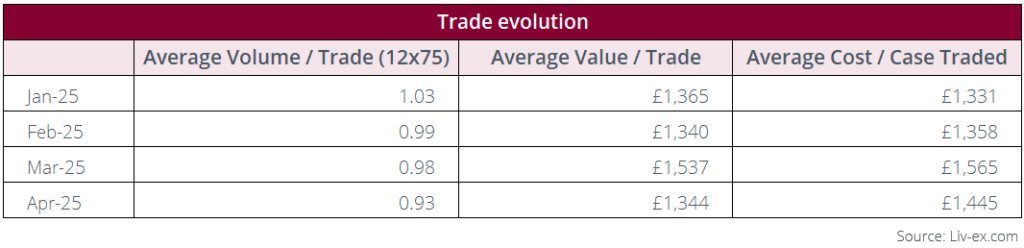
Total trade value fell 30.1% in April compared to March. While, to some degree, this can be attributed to the perennial combination of Bordeaux En Primeur tasting week and the Easter break, the long-awaited announcement of US tariffs on April 2nd also played a major role.
Trade evolution – 2025 year-to-date
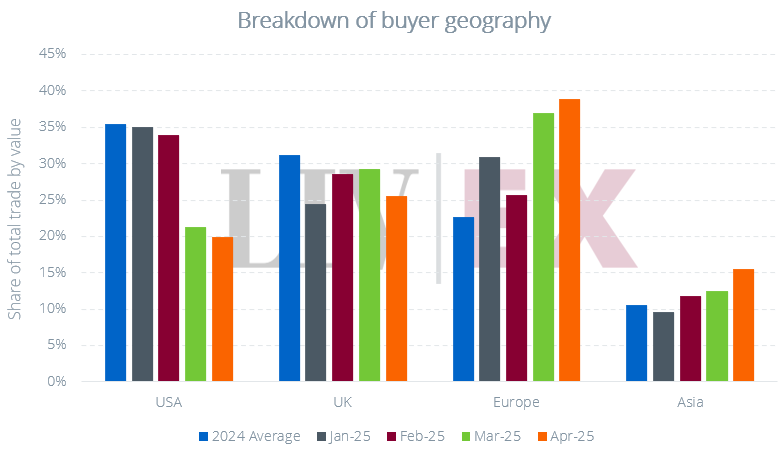
As one would expect, US buying continued to dwindle last month, closing with a 19.9% share of total purchase value. This is the lowest it’s been since January 2023. In nominal terms, US purchasing fell 34.8% from March, and was down 58.0% on its February level.
Meanwhile European purchase value fell 26.8%. However, with UK purchases falling further (-39.1%), the European share of purchases rose to 38.9%.
Less affected by the Easter lull, Asian buyers recorded the smallest fall of any geography in nominal terms (-13.6%). Despite this reduction, April Asian purchase value was 24.7% above the 2024 monthly average.
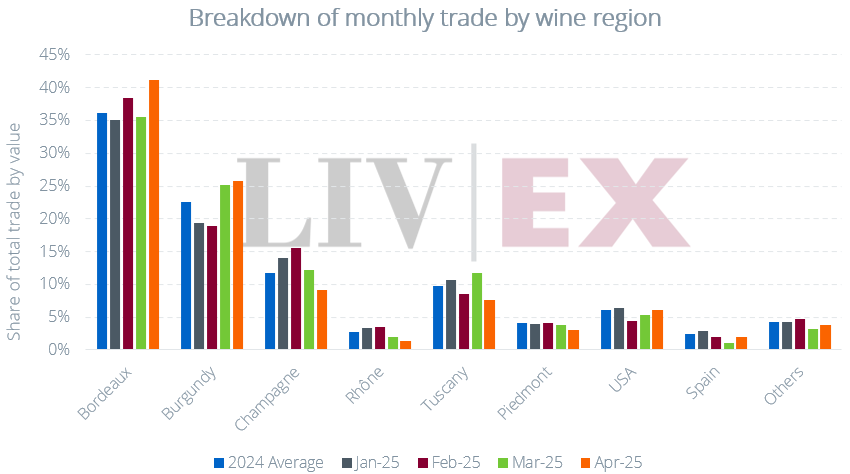
Breakdown of buyer geography – 2025 year-to-date
With US buyers taking a back seat in April, wine regions that have benefitted from strong US demand, such as Champagne and Tuscany fell back.
Market Share by Wine Region
Sentiment check
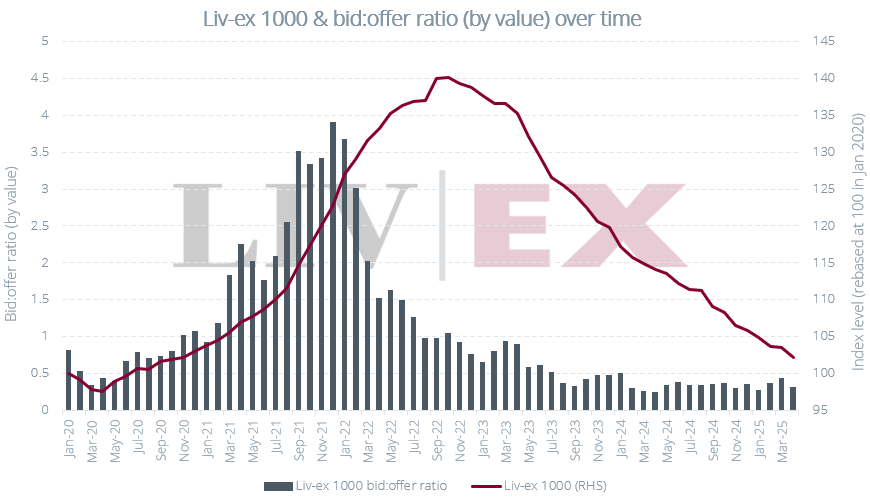
With the most significant purchasing region of late pulling its bids after the tariffs announcement, the bid:offer ratio of the Liv-ex 1000 fell during April, closing at 0.31. The total value of bids was down 24.7% in April, while offer value rose 1.5%.
Liv-ex 1000 bid:offer ratio by value
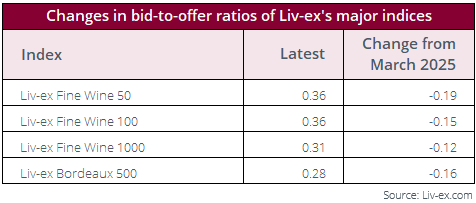
Of the major indices, it was the Liv-ex Fine Wine 50 that saw the greatest fall in the bid:offer ratio.
Month-on-Month bid:offer evolution of major Liv-ex indices
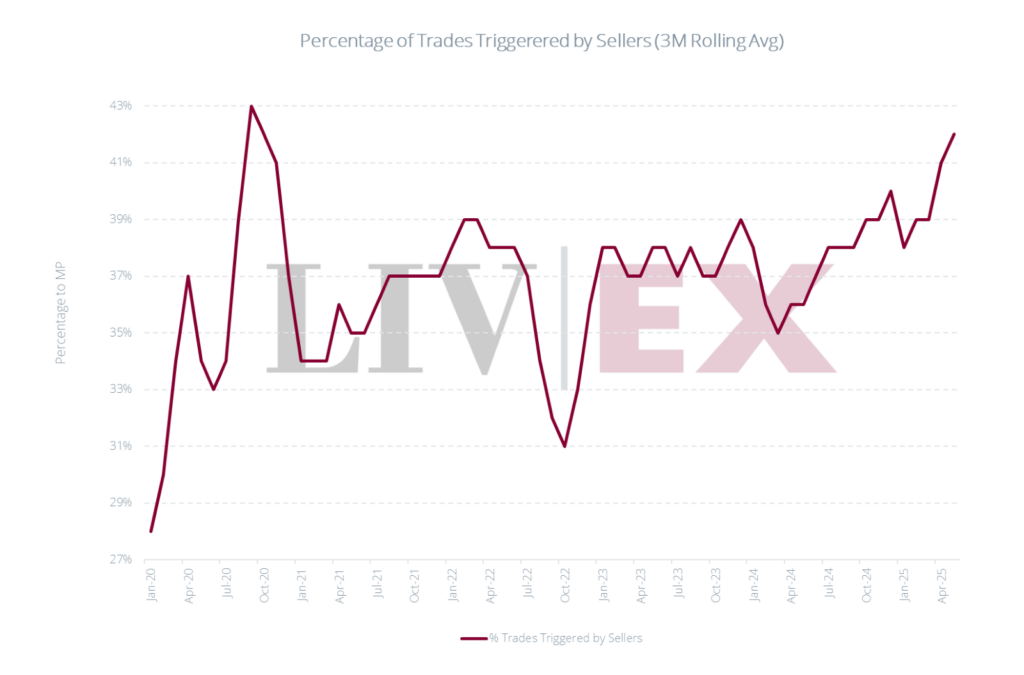
As buyers have withdrawn, the percentage of trades triggered by sellers has continued to rise, with an average of 41% of trades triggered by sellers over the past three months. This is the highest it’s been since September-November 2020.
Percentage of Trades Triggered by Sellers
Final thought – April US market activity
In last month’s Market Report we outlined three possible phases resulting from the introduction of tariffs:
- US greatly reduces buying for a period
- The reduction in demand prompts a further fall in prices
- US buyers come back when stock is required
As expected, US buying and, subsequently, prices have fallen sharply over the past month.
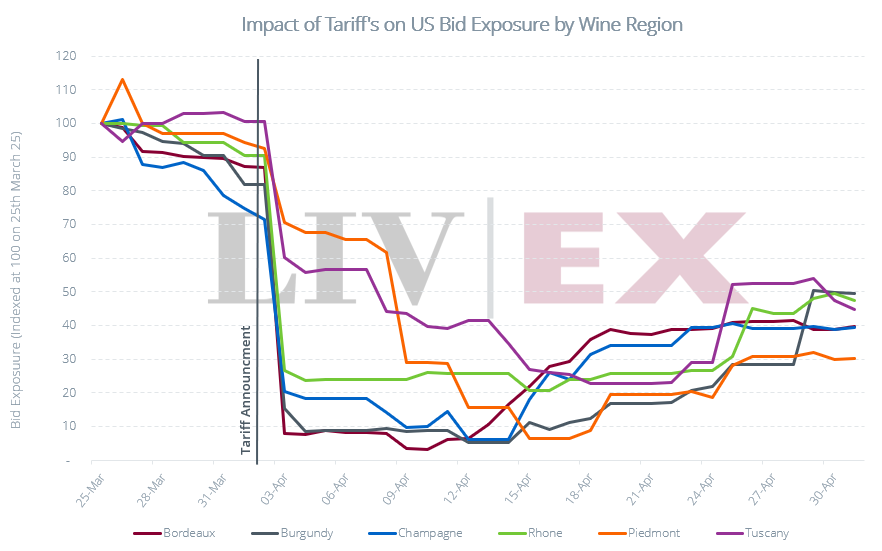
US bid exposure returns (to some degree)
While US buyers continue to take more of a back seat, since mid-April, US bid exposure has, on the whole, ticked back up. This makes sense. Once enough time elapsed for risk assessments to be completed, decisions to be taken on what percentage of the tariff to absorb, and a communication of one’s position to customers, one would expect some demand to rekindle.
Nevertheless, for each major wine region, total bid exposure is at least 50% below its pre-tariff level. In particular, US bid exposure for Piedmont has so far stayed the furthest below its previous levels.
US bid exposure by wine region
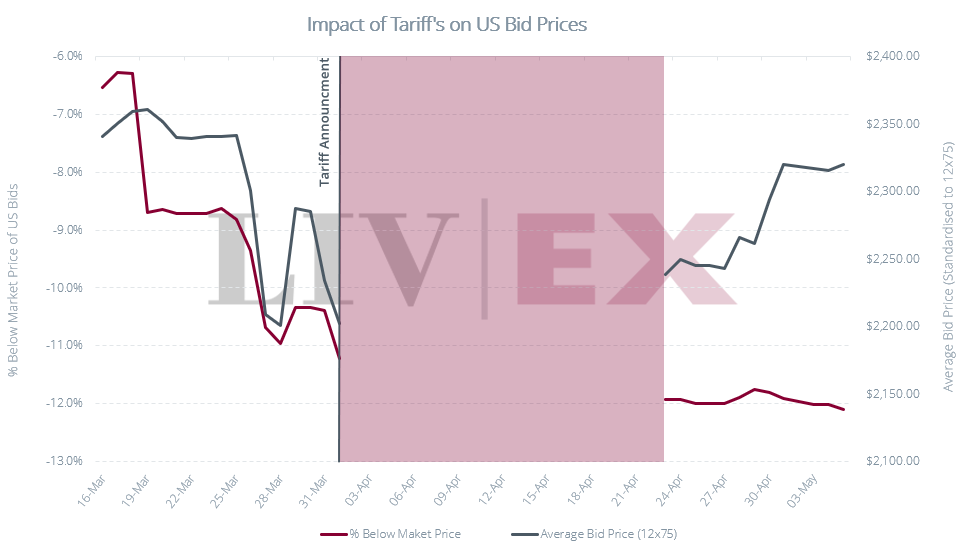
US buyers didn’t wait until the announcement on April 2nd to drop the value of their bids. They started after the threat of 200% tariffs on March 13th, before pulling most of them completely immediately after April 2nd. Where they have returned their bids, they have tended to bring them back at lower levels. The chart below includes a basket of 52 bids which were brought back after having been pulled on April 2nd.
US bid exposure levels
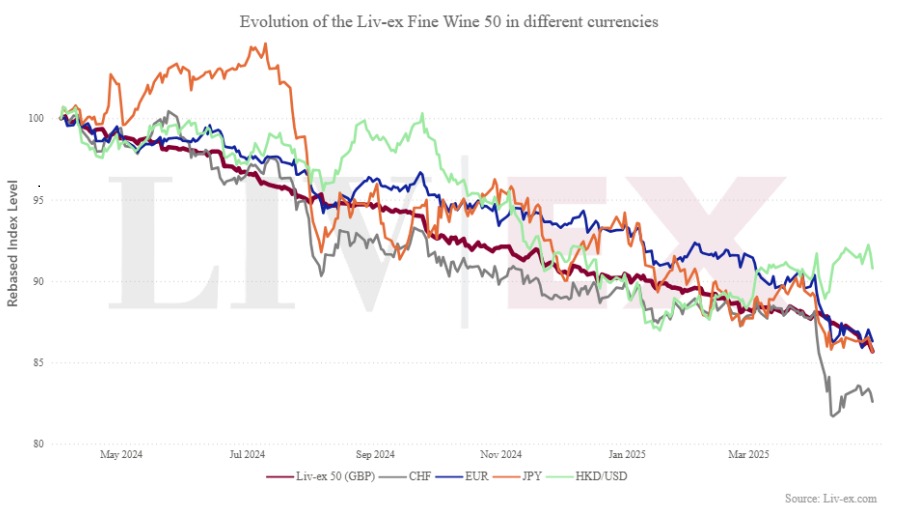
US Dollar Weakness
However, while tariffs sit at 10% until July 9th, a weaker dollar is another problem with which US buyers have to contend. Despite rising off the back of the temporary reduction in tariffs on China on May 12th, the USD:Euro exchange rate still sits below the pre-tariff level. As the chart below indicates, the Fine Wine 50 has diverged significantly with forex swings over the past month.
Evolution of the Fine Wine 50 in different currencies
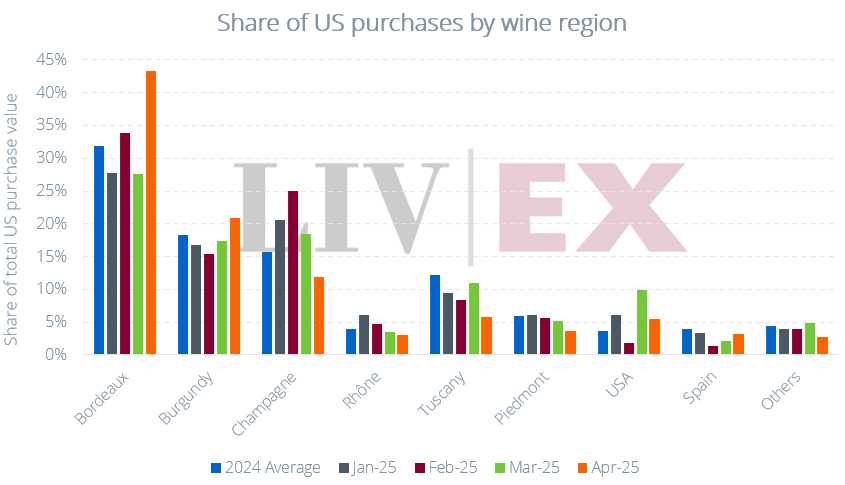
What has the US been buying?
Interestingly, April saw Bordeaux’s share of total US purchase value rise, with the region accounting for 43.3% of all US purchases, well above the average recent share.
Share of US purchases by wine region
Conclusion
While the 90-day reduction in EU wine tariffs has brought some temporary respite, the situation remains one of severe uncertainty. For instance, it is unclear whether there might be any changes to a goods on the water policy. Given this lack of clarity, it is likely that US buyers will continue to sit tight until July 9th when a further decision can be expected.
Liv-ex analysis is drawn from the world’s most comprehensive database of fine wine prices. The data reflects the real-time activity of Liv-ex’s 620+ merchant members from across the globe. Together they represent the largest pool of liquidity in the world – currently £100m of bids and offers across 20,000 wines.
Independent data, direct from the market.
Fill in your details below and we’ll be in touch.