What’s happening in the market?
Petrus is the top-traded brand of the week so far, with several vintages changing hands in OWCs. For the most part, trade prices of Petrus have now returned to their 2020 / 2021 lows.
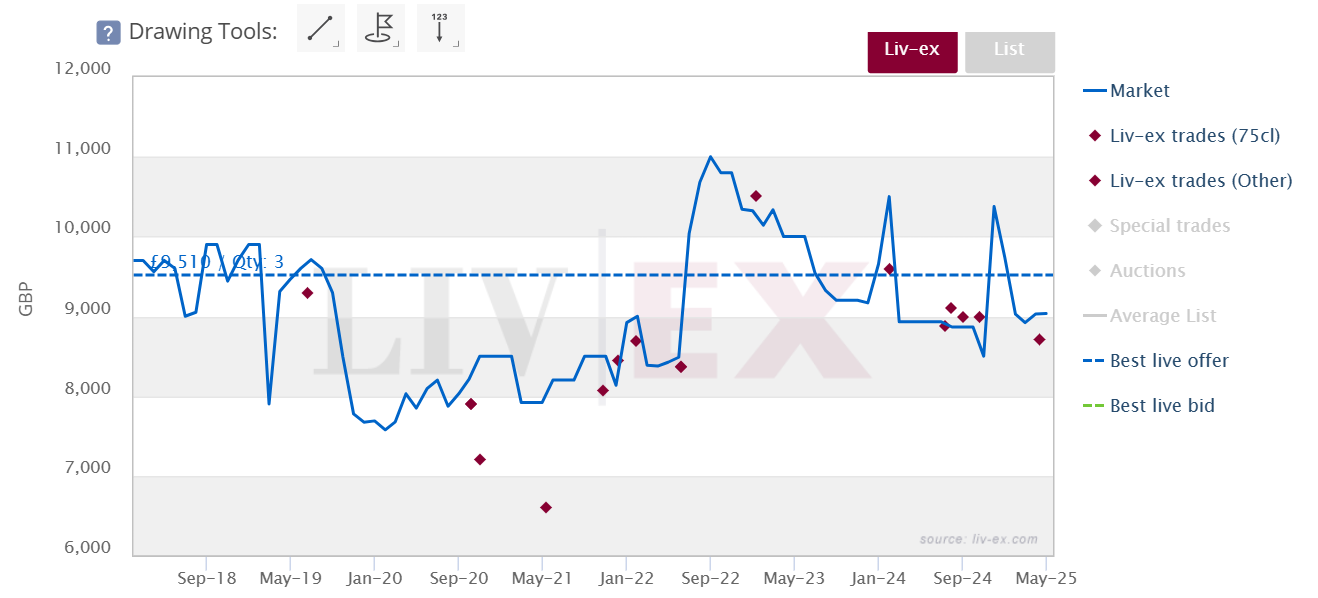
Opus One 2021 is the top-traded individual wine, trading in high volumes at £2,604 per 12×75.
Today’s deep dive: Harlan Estate
Over the years, Harlan Estate has solidified its standing in the market, coming in as the third top-traded US wine by value this year. Historically, this trade has been almost entirely driven by UK buyers. This remains true to an extent, but Harlan has drawn a broader audience in recent months. Asian buyers have accounted for 28.6% of Harlan purchasing this year. As with most wines in these current market conditions, prices of Harlan have fallen over the past two years. But, technical analysis of the Harlan index provides some grounds for belief that prices may soon find support.
Technical analysis of the Harlan Index
- Navigating a corrective phase but upholding its long-term upward trend, the Harlan index has recently reached a critical support zone.
- Prices consolidating in a downward wedge and a bullish divergence between price and RSI favour an upside breakout.
- Which vintages present the best opportunities?
Since mid-2015, the Liv-ex Harlan Estate Index has been trending upwards, on several occasions finding support and bouncing back on its long-term trendline (such as in 2017, 2020 and 2021. Within this broader bullish framework, however, the index is currently weathering a corrective phase. On the bright side, prices are consolidating within a falling wedge pattern, a formation that typically precedes a bullish breakout.
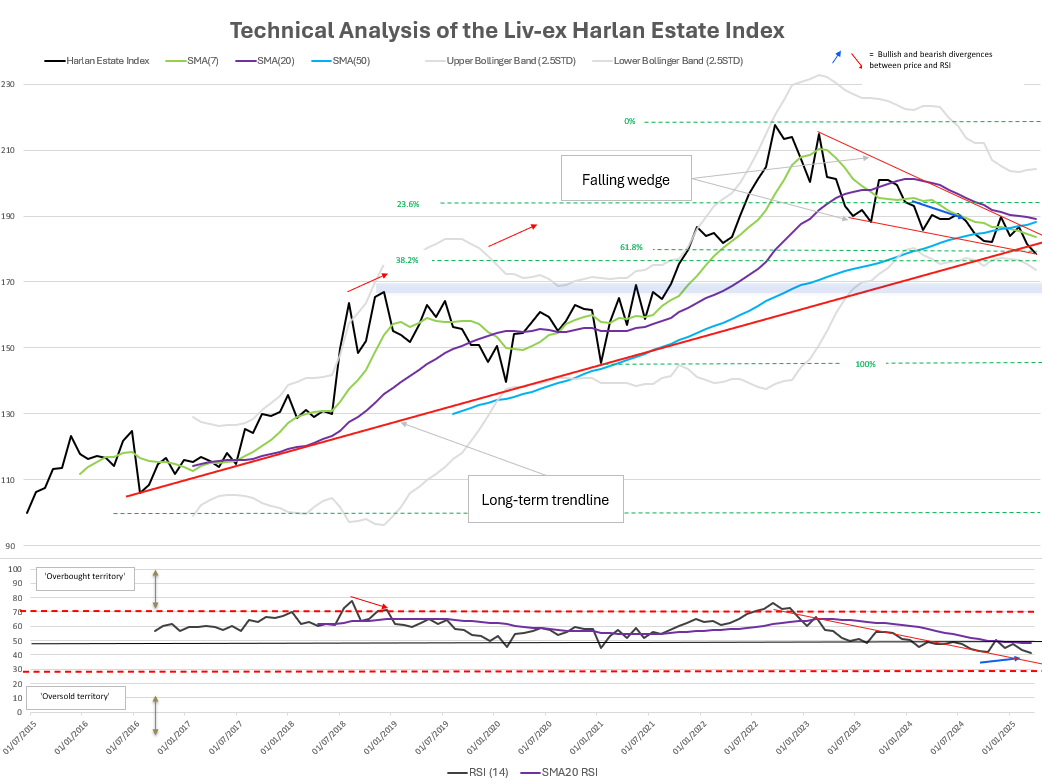
The index is currently trading at 178.5, supported by the lower boundary of the falling wedge, and the 61.8% Fibonacci retracement level. It has, however, crossed below its long-term trendline. A deeper support zone lies at 164, a critical horizontal level at the index’s 2018 highs, which, if breached, could lead to a more material deterioration in price structure.
The Simple Moving Averages tell a slightly more negative story. The shorter-term 7-month and 20-month simple moving averages (SMA) have flattened and converged with the price, indicating a lack of short-term directional conviction. The SMA50, while still rising slightly, is losing momentum.
The Relative Strength Index (RSI) has been steadily declining alongside the correction in price. It remains in bearish territory but has not yet entered oversold conditions, indicating the potential for further short-term weakness. On the other hand, a bullish divergence has formed between price and RSI (index making new lows, RSI reaching the same low) — an indicator that the bearish trend is losing momentum.
The Bollinger Bands (BB), after a period of significant contraction, have recently begun to widen, implying that volatility is likely to rise. Such expansions following a squeeze often precede substantive directional moves. The direction remains uncertain at this stage, but the prevailing technical configuration — particularly the falling wedge — favours an upside breakout.
While the Liv-ex Harlan Estate Index continues to respect its long-term upward trend, the short- to medium-term conditions hang in the balance. The current setup within a falling wedge suggests a bias toward an eventual bullish breakout; however, confirmation through a sustained move above 185.8, coupled with a breakout in RSI and supportive expansion in volatility, will be essential to validate this view. Until such signals materialise, risks of further retracement toward 164 remain.
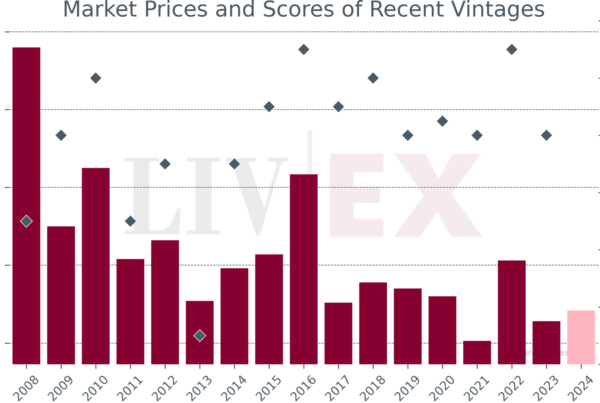
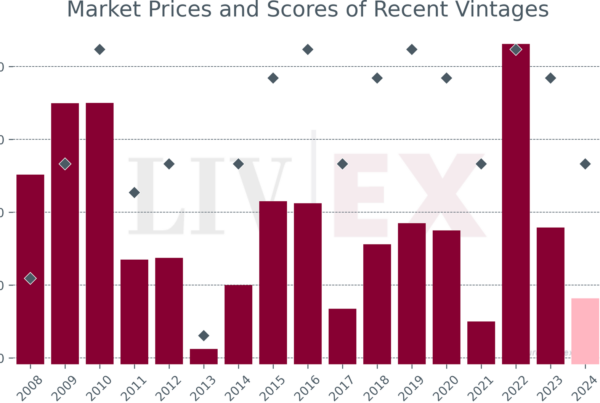
Which vintages to buy?
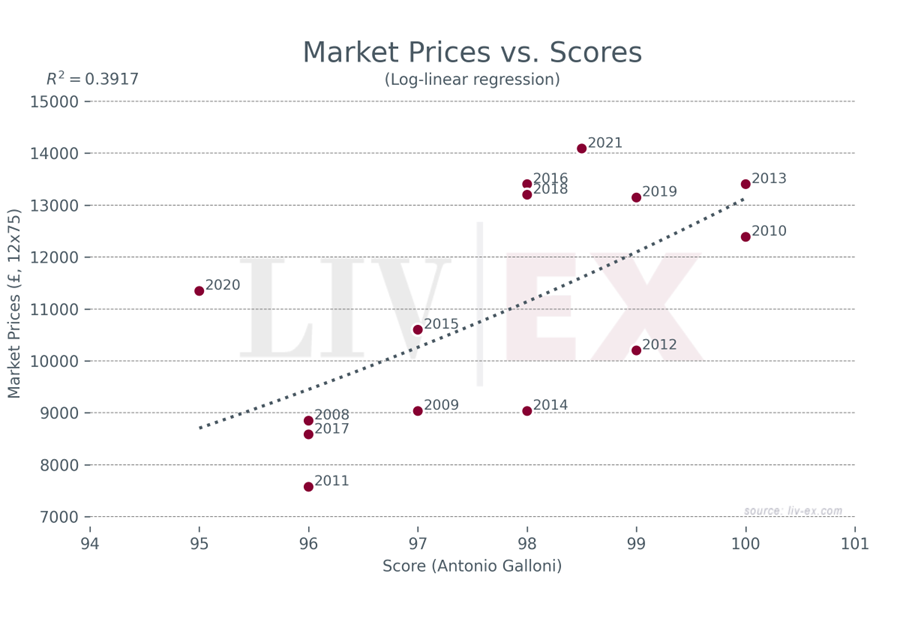
Considering the graph above, the 98-point 2014 and 99-point 2012 vintages look particularly attractive. Moreover, both appear to have recently found support on their long-term upward trendlines, with buyers finding value at these entry points.
Harlan 2012
Harlan 2014