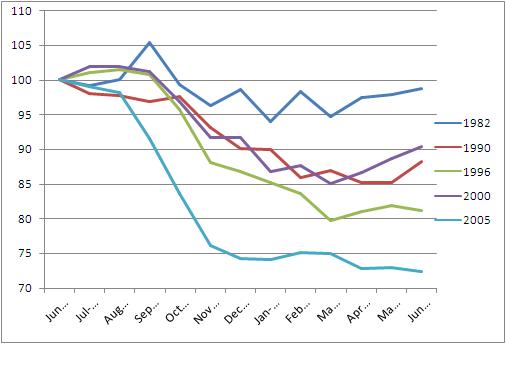
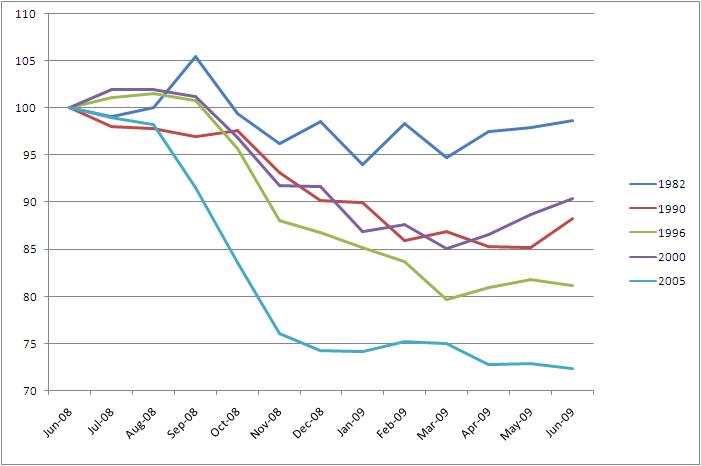
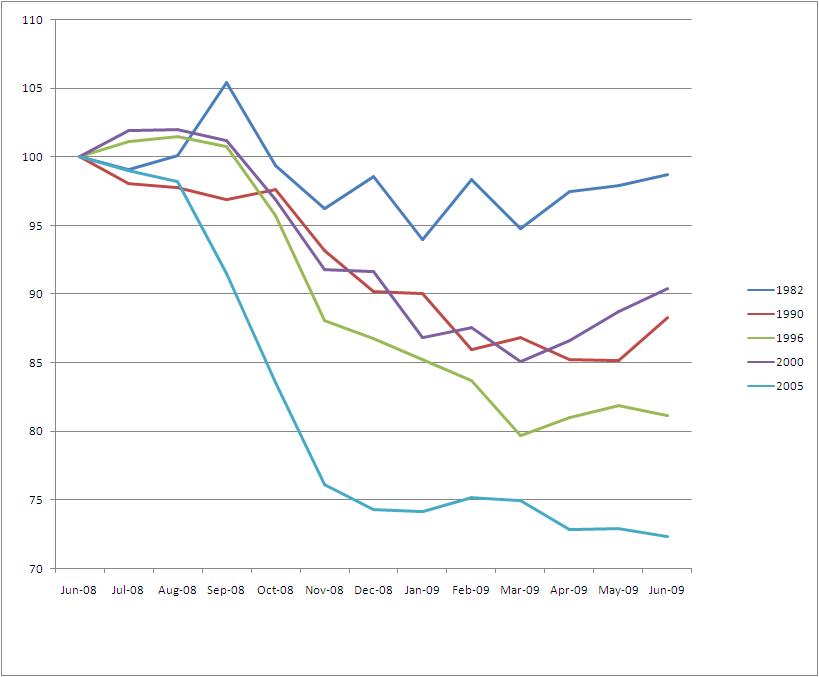
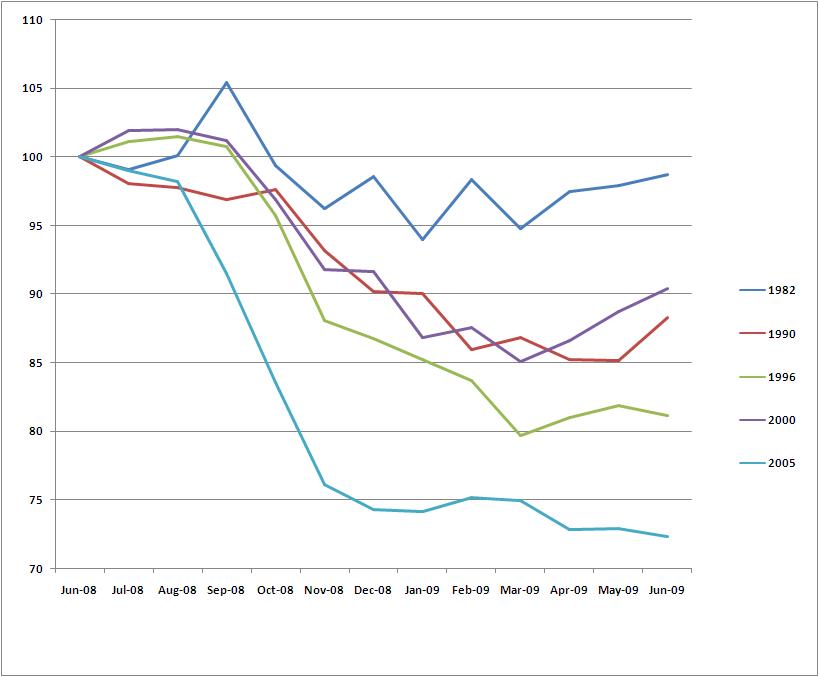
The graph below charts the performance of the five first growths since June 08.

It clearly demonstrates the effect the credit crunch had on prices at the tail end of last year and, interestingly, shows which vintages were more resilient to the feared price decreases. A general observation might be that the laws of demand and supply came to the fore- thus the marked difference in the performance of 1982 vs 2005.
However, those now wanting to take advantage of the current conditions could do worse than to reconsider the 2005 and 1996 vintages. A switch perhaps out the 1982s?


